Introduction:
The sophisticated HS Analysis Deep learning software is able to detect a plethora of sicknesses, one case is Chronic myeloid leukemia, (CML) is a type of aggressive cancer that begins in the bone marrow’s blood forming cells and attacks white blood cells and bone marrow, causing the immune system to weaken which spreads throughout the body. Specialists at HS Analysis are able to use advanced deep learning AI software to diagnose CML expertly along with its classes to aid clinics, institutions and health care facilities.
Gram’s Staining for CML
In hematology, various staining methods are used to visualize blood cells and their specific components. One of the most commonly used staining methods is called the Gram stain.
The Gram stain technique was originally developed for differentiating bacteria in microbiology. It is based on the differences in cell wall structure among bacterial species. However, the Gram stain can also be employed in hematology to identify certain cell types.
During the Gram staining process, blood cells are fixed on a slide and treated with a special staining mixture. This mixture typically contains crystal violet, Lugol’s solution, and ethanol. As a result of the staining, the cell walls of certain cell types retain the color, while other cell types lose the stain during subsequent treatment.
After staining, the cells are observed under a microscope. Typically, granulocytes such as neutrophils or eosinophils appear violet or blue after Gram staining, while lymphocytes and monocytes lose their original color and become decolorized.
It is important to note, however, that the Gram stain is not a routinely used method in hematology. Other staining techniques, such as the Giemsa stain, are more commonly employed to stain and analyze blood cells.
The Gram staining is sometimes used to help diagnosing the chronic myeloid leukemia (CML). CML is a type of blood cancer characterized by an overproduction of immature white blood cells. The diagnosis of CML requires more specific diagnostic procedures.
The diagnosis of CML typically involves a combination of physical examination, blood tests, and imaging studies. The key diagnostic method for confirming CML involves examining the blood under a microscope to identify abnormal blood cells.
During the examination of the blood smear, specific changes in the blood cells that are characteristic of CML are observed. These include the presence of the Philadelphia chromosome, a specific genetic mutation, as well as an increased number of immature white blood cells, particularly myeloid precursor cells.
Additional diagnostic procedures used in CML may include bone marrow aspiration and biopsy, where tissue samples are taken from the bone marrow and examined. Genetic tests and molecular investigations can also be performed to detect the presence of specific gene mutations, such as BCR-ABL1, which are associated with CML.
It is important that the diagnosis and treatment of CML are conducted by experienced hematologists, as it is a complex disease that requires an individualized approach.
Bone Marrow Diagnostic with HSA KIT
In chronic myeloid leukemia (CML), the appearance of the bone marrow can show characteristic changes indicative of the disease. During a bone marrow examination, the following features may be observed with immunohematology:
- Increased Cellularity: The bone marrow in CML is typically hypercellular, meaning there is an increased number of cells compared to normal. This is due to the overproduction of myeloid cells, particularly granulocytes (neutrophils, eosinophils, and basophils), which are typically elevated in CML.
- Left Shift: The term „left shift“ refers to the presence of immature or precursor cells in the bone marrow. In CML, an increased number of myeloid precursor cells, called myeloblasts, can be observed. These cells are not typically found in significant numbers in the bone marrow of healthy individuals.
- Philadelphia Chromosome: The Philadelphia chromosome, a genetic abnormality resulting from a translocation between chromosomes 9 and 22, is a hallmark of CML. This abnormality leads to the formation of the BCR-ABL1 fusion gene. The presence of the Philadelphia chromosome can be detected through cytogenetic testing or molecular techniques in the bone marrow cells.
- Increased Megakaryocytes: Megakaryocytes are large cells responsible for platelet production. In CML, there is often an increase in the number and size of megakaryocytes in the bone marrow.
HSA KIT will support you to detet these features, along with other clinical and laboratory findings, help in the diagnosis and classification of CML. It is important to note that the specific appearance of the bone marrow may vary among individuals, and additional tests, such as genetic analysis or molecular testing, may be required for a definitive diagnosis of CML.
Deep Learning
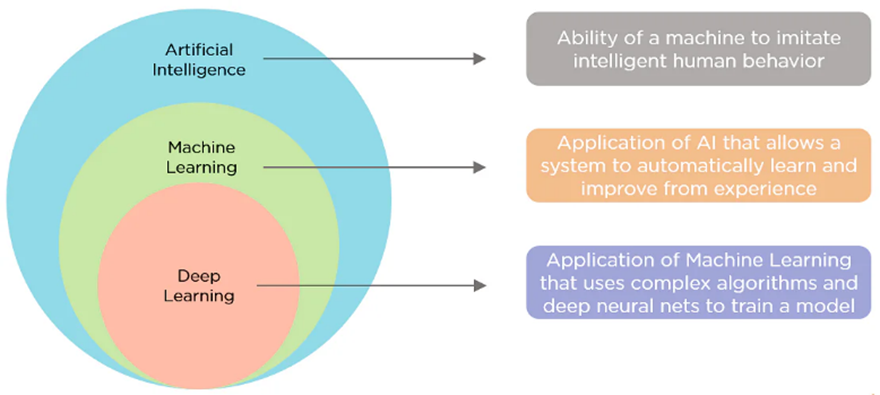
Deep learning is a sub-set of machine learning which is a subset of AI. AI can merely be a programmed rule that tells the machine to behave in a specific way in certain situations. In other words, artificial intelligence can be nothing more than several if-else statements. In order to reduce the mistakes of its own predictions of the model vs. the facts, machine learning requires significant user input. An extremely powerful framework for deep learning in the modern era, a DL network can express functions of increasing complexity by adding additional layers and units inside each layer.
Given a suitably big model and dataset of labeled training samples, deep learning can typically complete tasks that involve mapping an input sequence to an output sequence quickly and easily. Deep learning requires stronger and better computer hardware in order to operate successfully.
Cost and Loss Function
The reduction of error between predictions and true values is the aim of DL model development. Using loss functions linked to each training example, this is accomplished. The average of the loss function values over all data samples is the cost function. The cost function is improved to lower the DL error. We can attain the greatest outcomes in DL by improving the cost function.
Metric
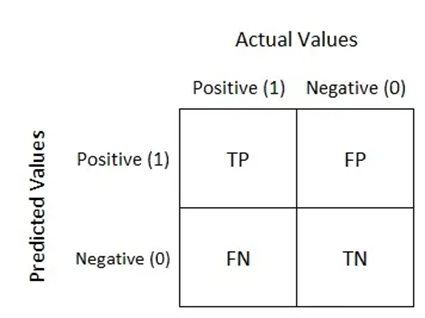
The effectiveness of algorithms for comprehending medical images is evaluated using a variety of measures. The table used to visualize algorithm performance and determine multiple assessment metrics is called the confusion matrix. Confusion matrices are used to evaluate deep learning models and give a more realistic view of their performance. The output could have two or more classes. In the table, there are four possible combinations of anticipated and actual values.
Mean Average Precision
Mean Average Precision (mAP) is a metric used to evaluate object detection models. Confusion Matrix, Intersection over Union (IoU), Recall, Precision are the sub-metrics that form the backbone of the formula for the mAP accuracy. The mAP is calculated by finding Average Precision(AP) for each class and then average over a number of classes.
The HS Analysis‘ touch:
One key technology of automatic interpretation of tissue samples in the HS Analysis software is the latest artificial intelligence. Deep learning evaluates a statistical predictive model for CML analysis by using algorithms to „learn“ how to recognize CML disease and gain access to variables that predict CML survival. Some examples include quantification, diameter measurements, and the separation of healthy and unhealthy cells.
The HS Analysis software can help medical professionals diagnose disorders by examining high-resolution images of tissues and organs. And as the program generates data describing the patient’s current condition, it will assist doctors in selecting appropriate therapies, some examples of treatments will be discussed later in this blog.
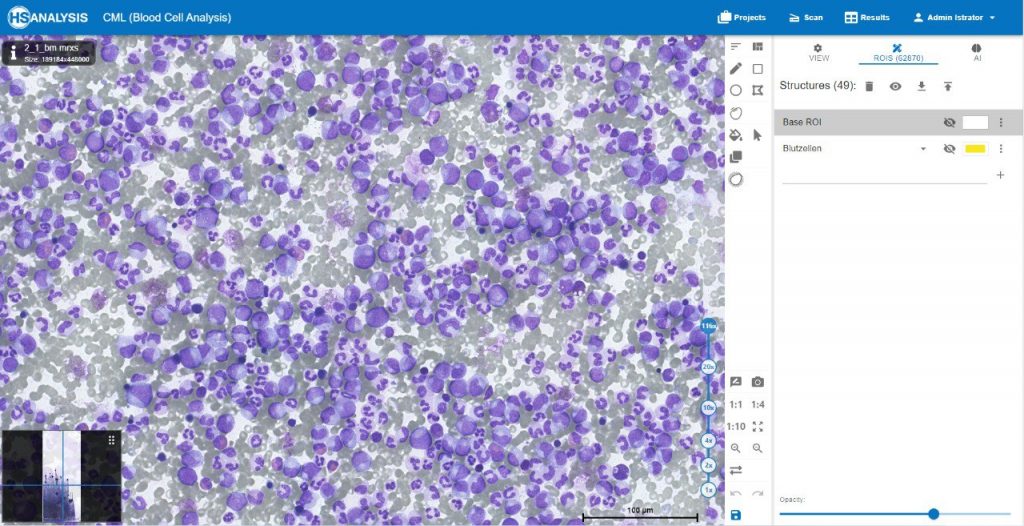
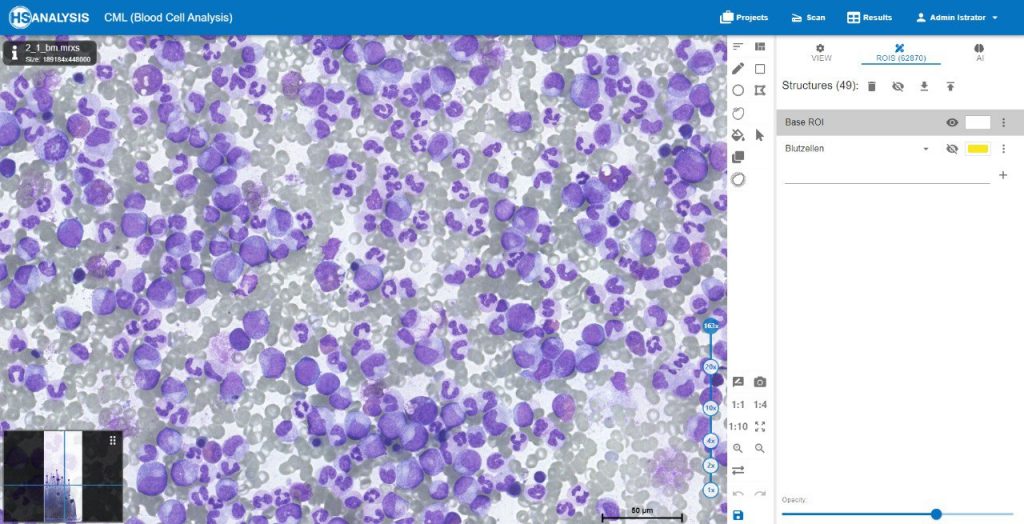
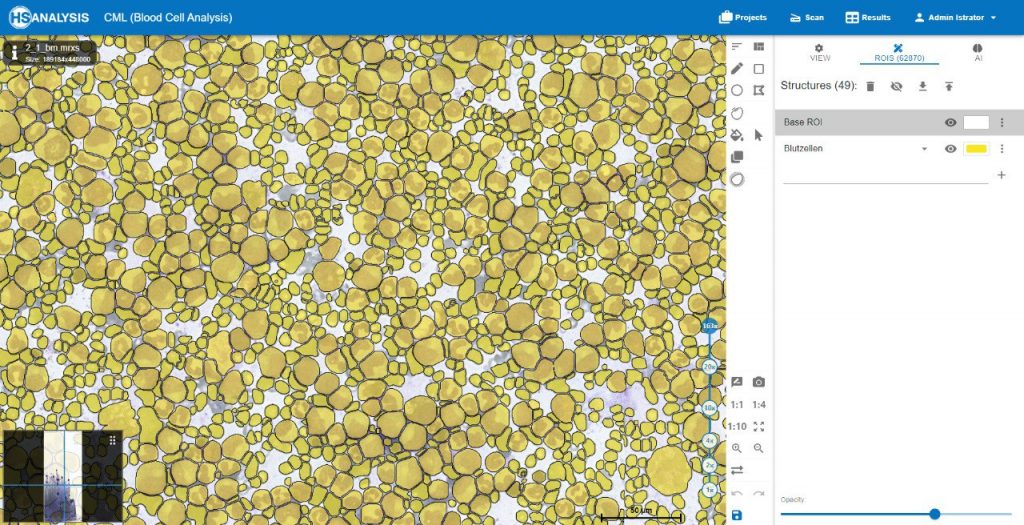
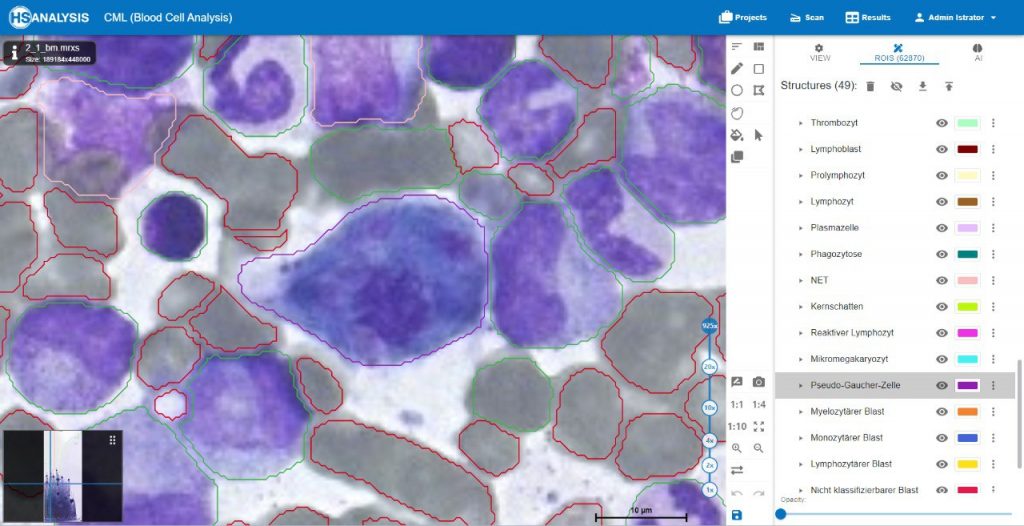
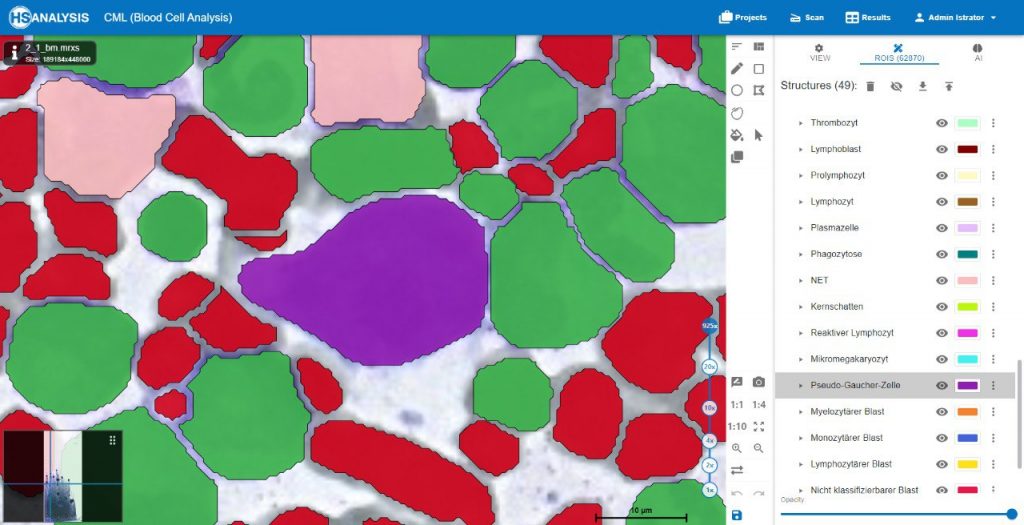
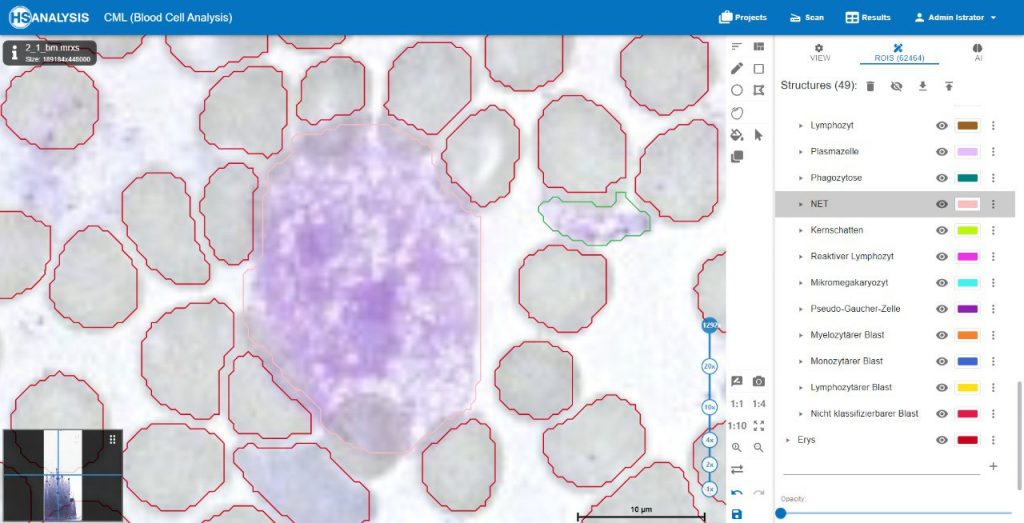
The images below show the UI of HS Analysis KIT, in which the project name, tool bar and tabs, etc… can be seen.
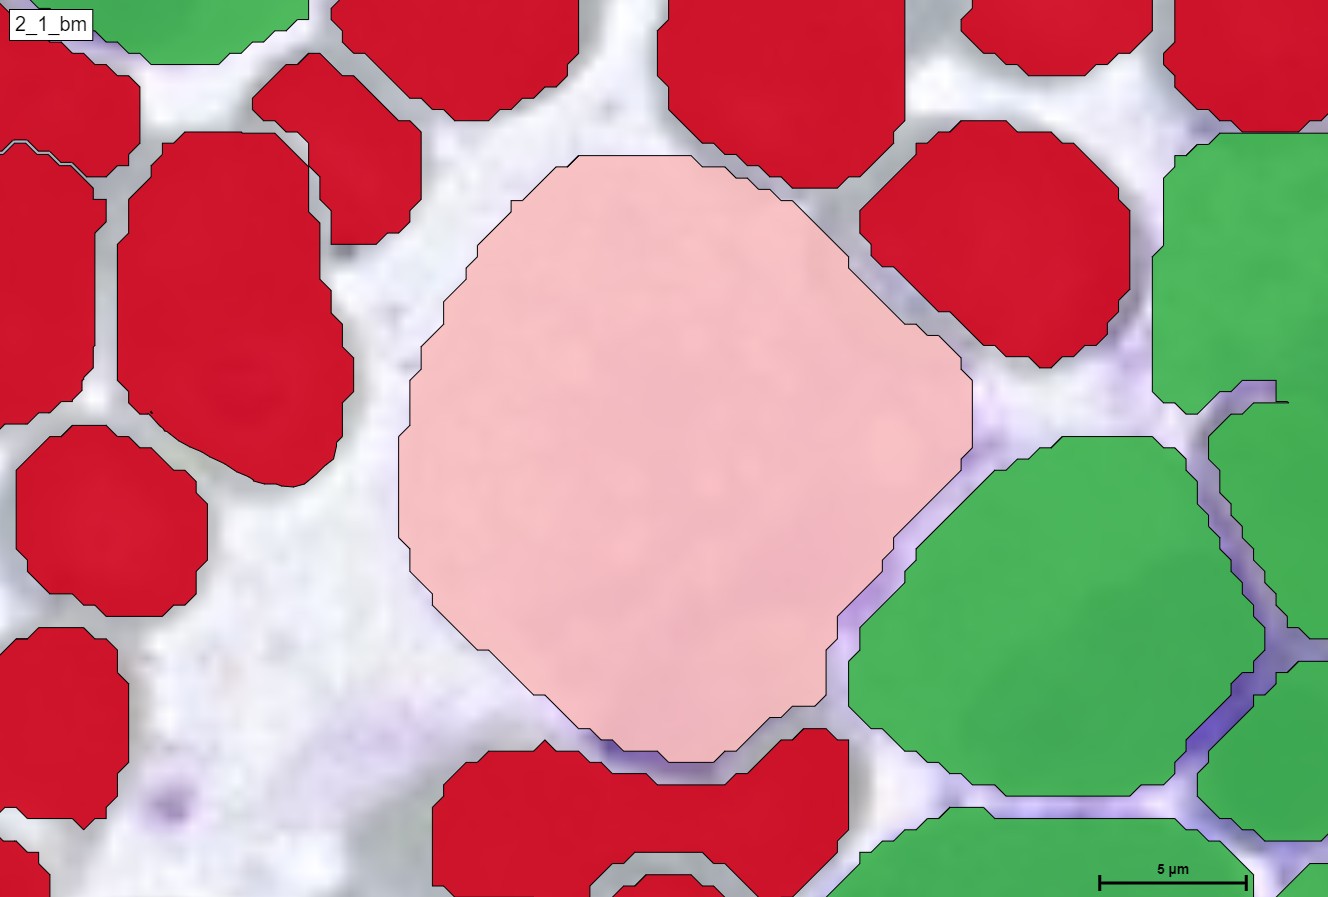
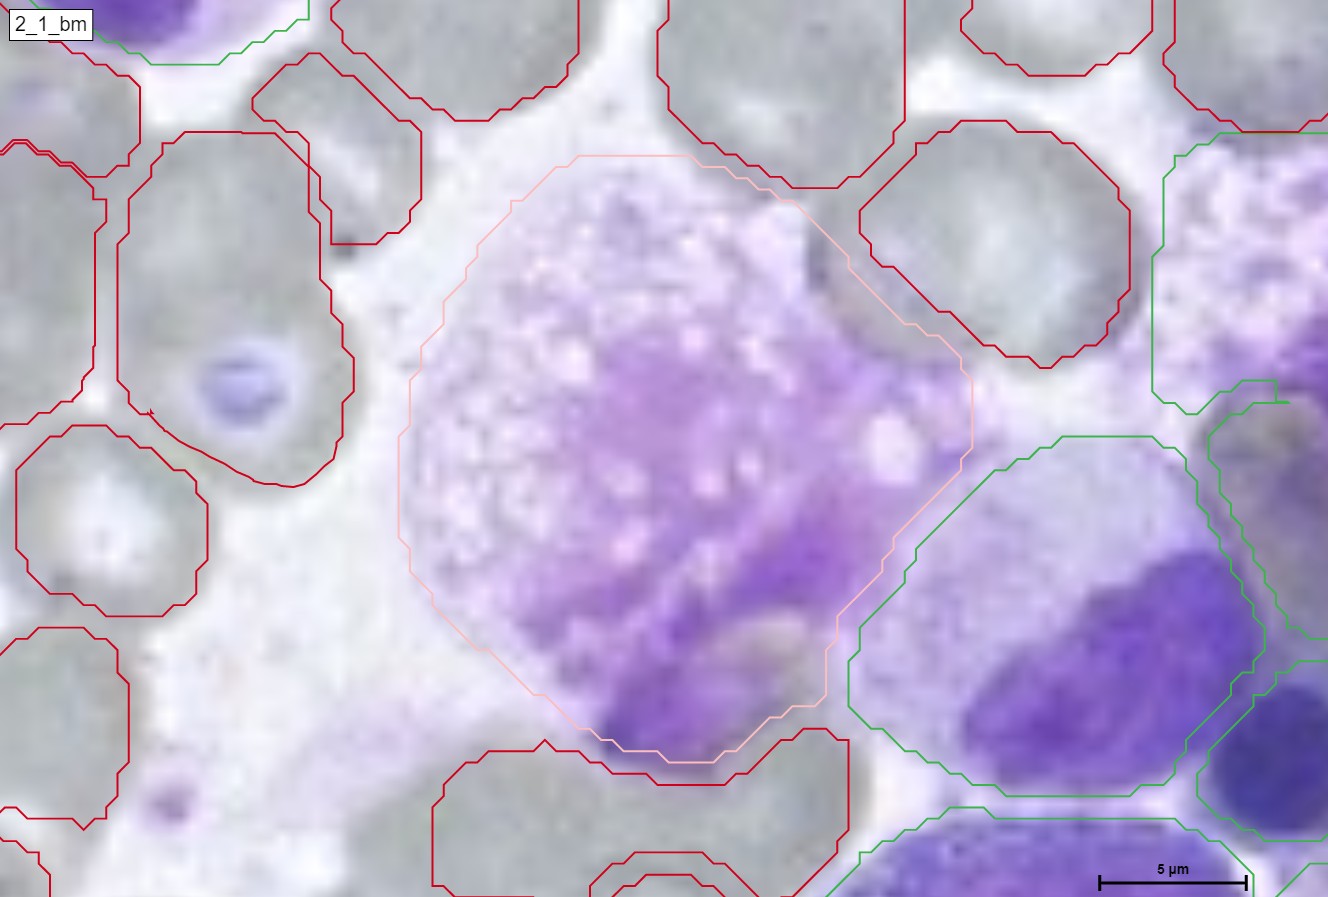
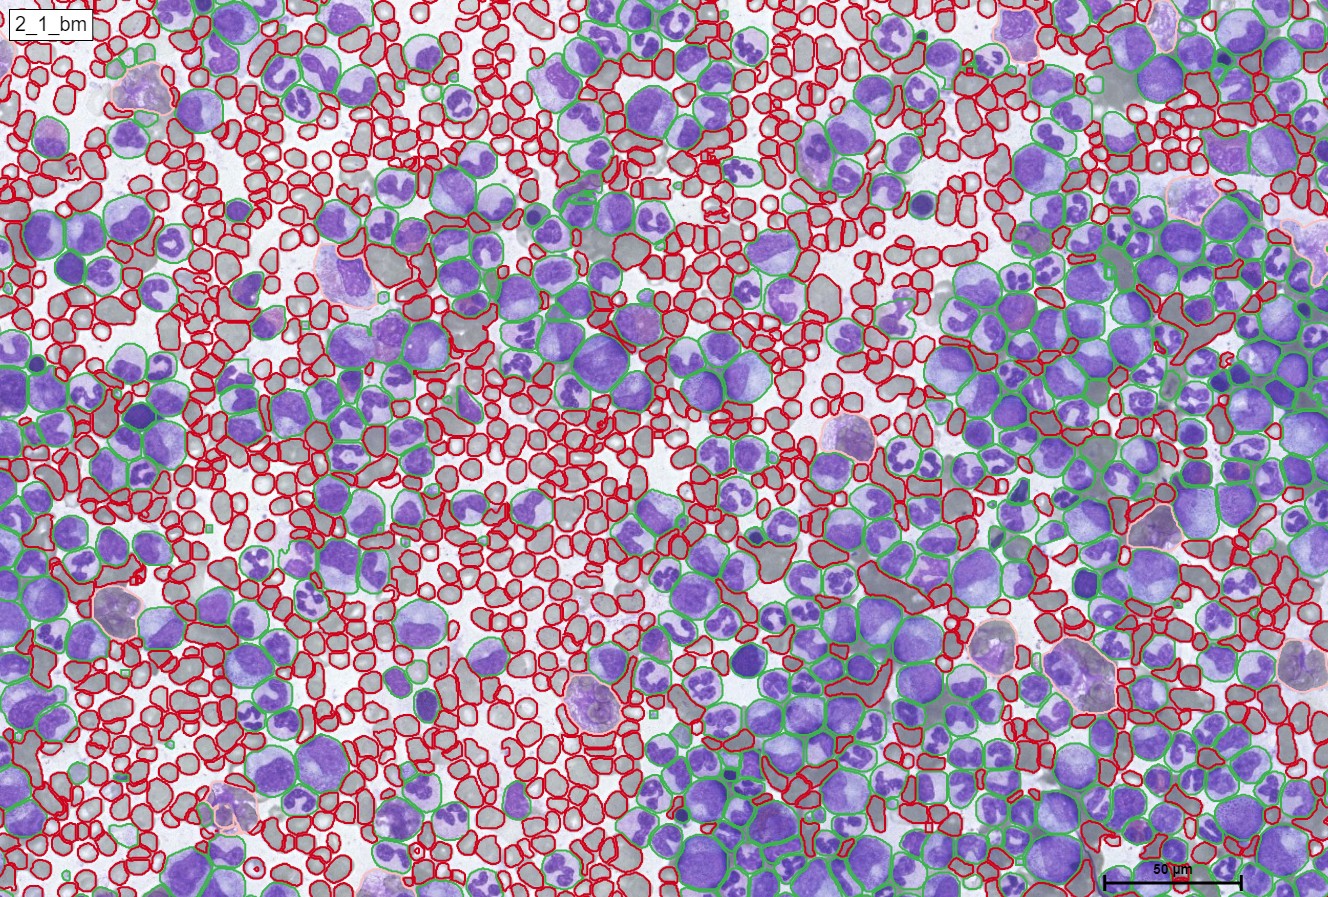
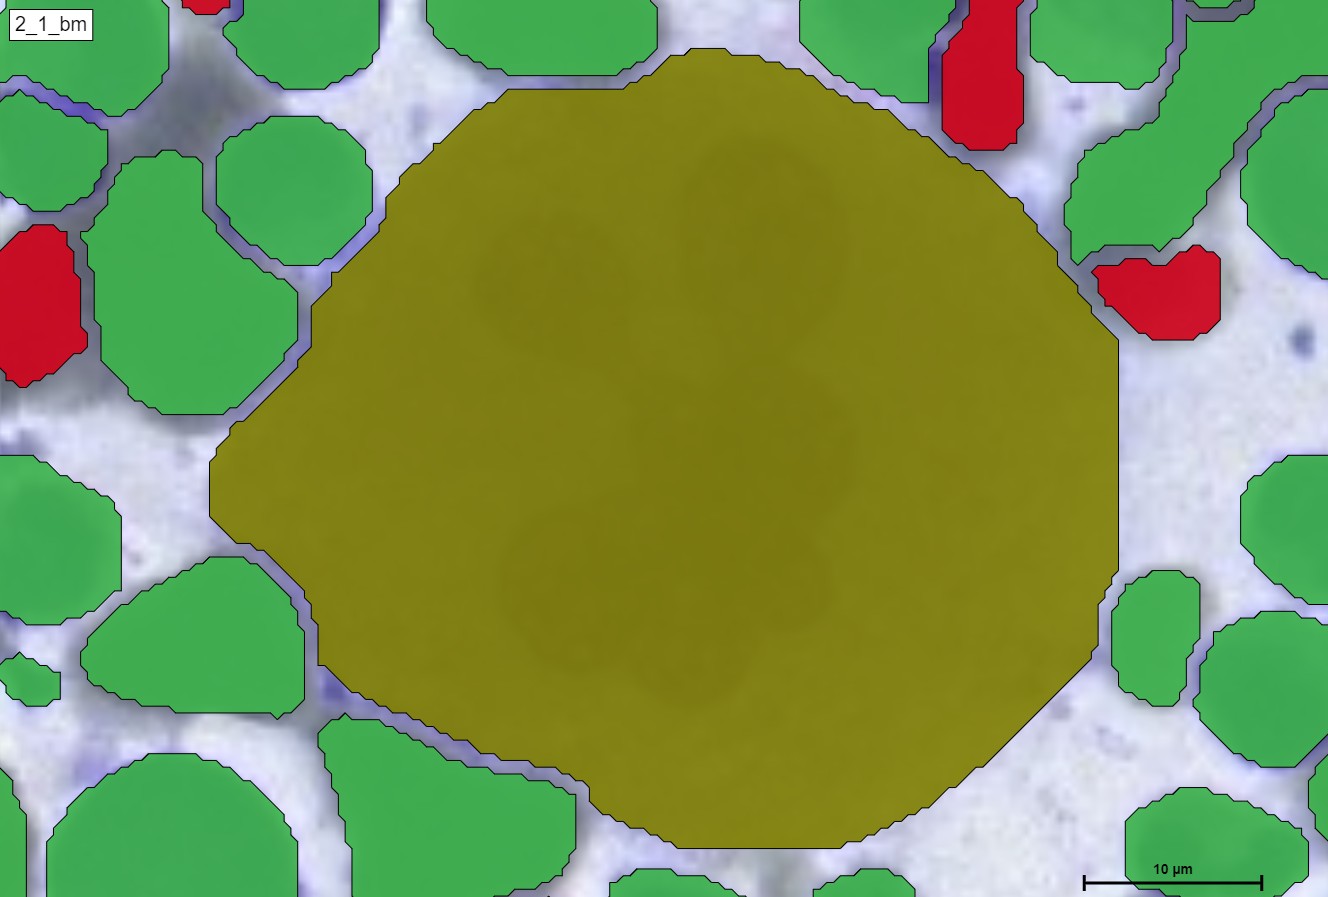
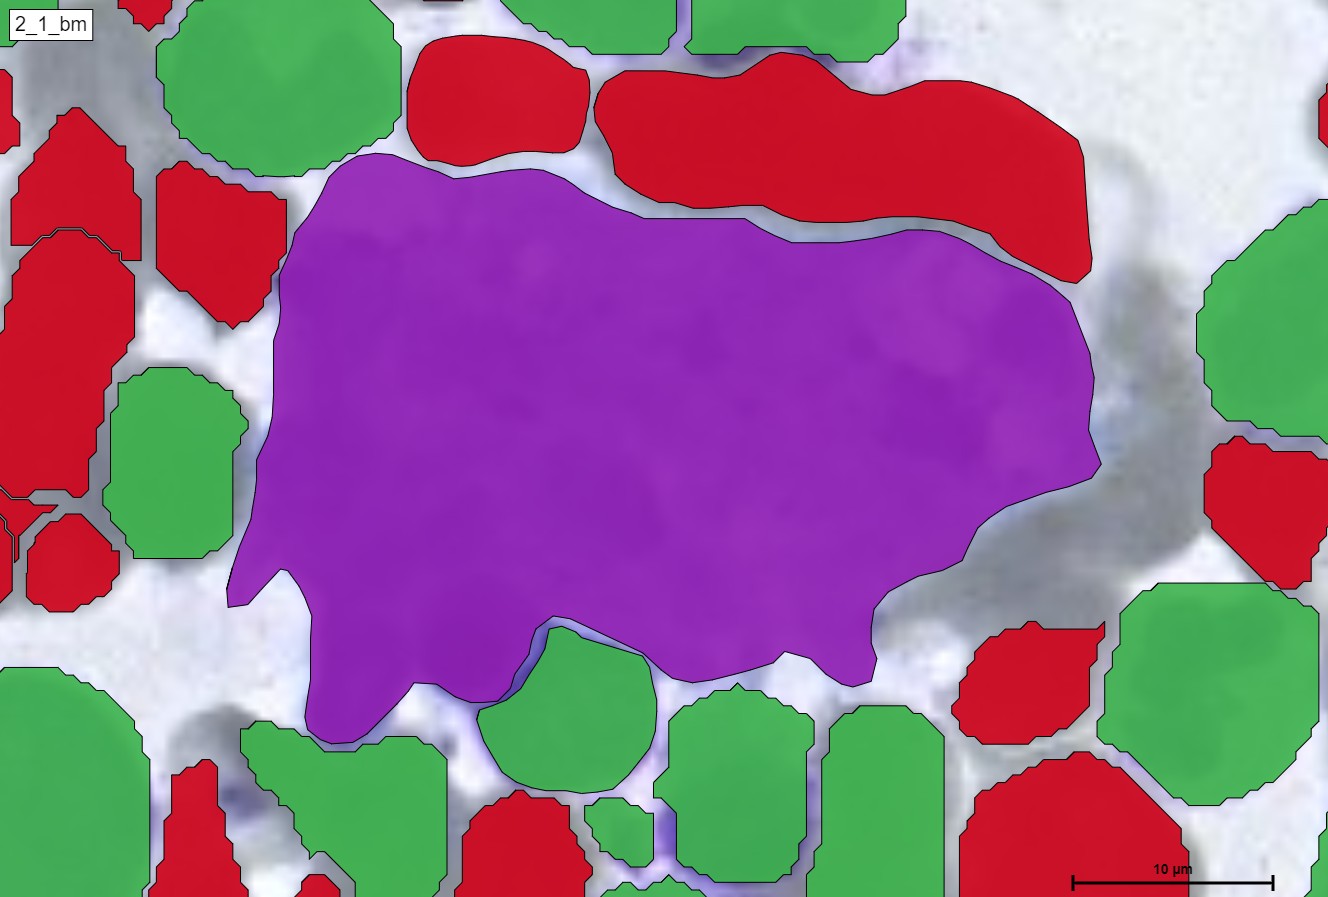
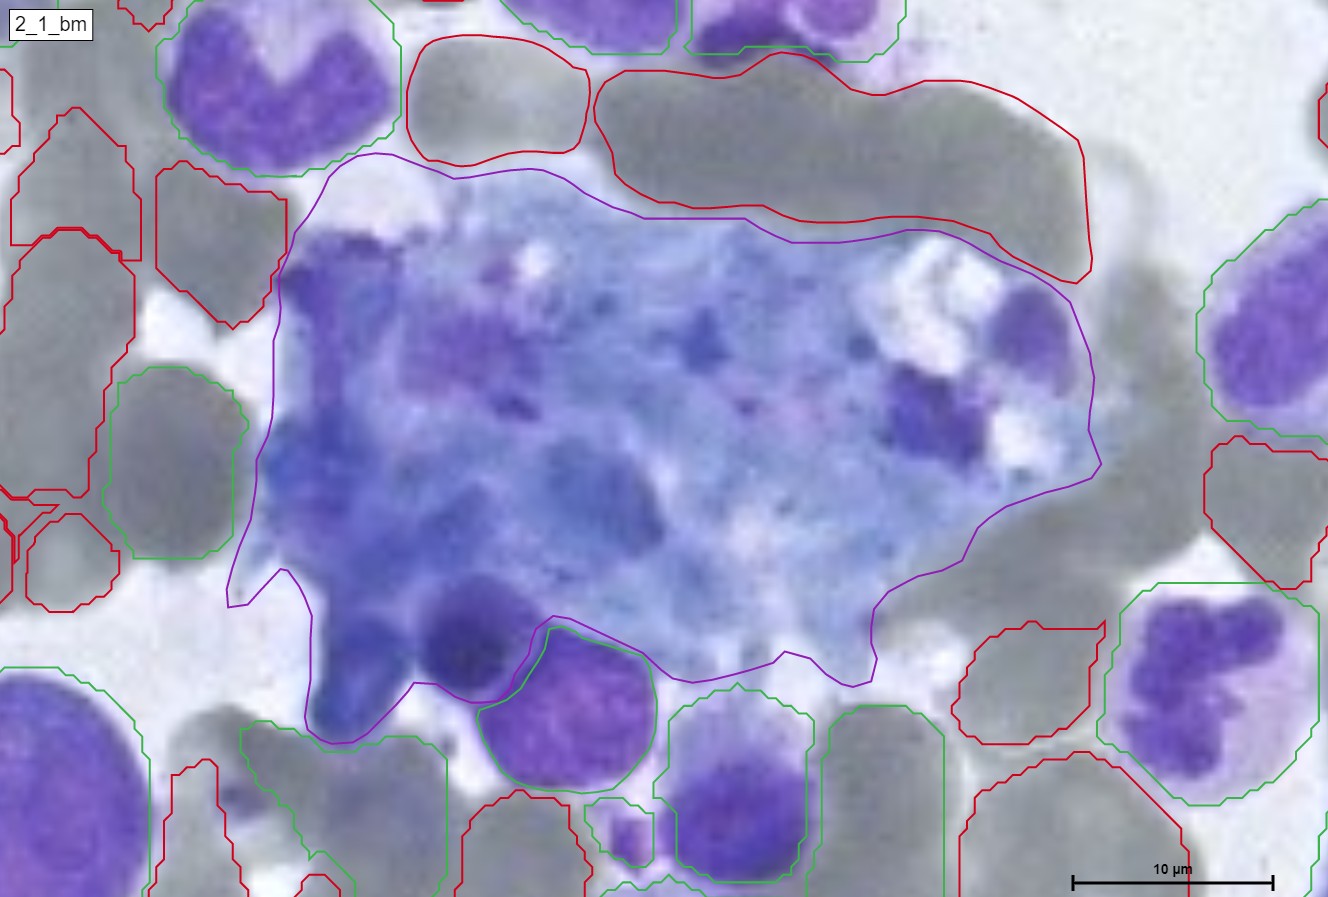
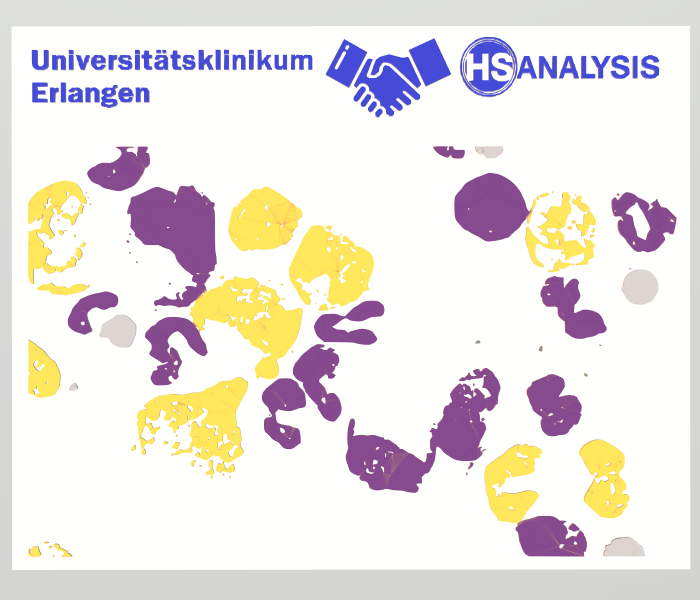
Within the regions of interest, drawings with manual user annotations are made. After studying the annotations, the deep learning model applies them to several, larger regions of interest. The individual cell is annotated with respect to its type for example, the following images display that the Blood cells can be seen with Yellow, the healthy cells are distinguished by red whereas the un-healthy ones are Green. Their classes will be explained later on.
Neutrophil Extracellular Traps (NETs) are specialized cells of the immune system, specifically neutrophil granulocytes, that play a crucial role in immune defense. NETs are networks of DNA threads filled with antimicrobial proteins and cellular components. They are released by neutrophil granulocytes to capture and combat pathogens.
Upon activation of neutrophil granulocytes, such as in response to infection or inflammation, NETs are released. The neutrophil granulocytes unwind and extrude their chromosomal DNA material, releasing antimicrobial proteins that can kill bacteria, fungi, and other pathogens. The NETs form a network that captures the pathogens and prevents their further spread.
While NETs have an important function in defending against infections, they can also contribute to certain immune-mediated diseases. If NETs are excessively activated or not efficiently cleared, they can lead to an exaggerated inflammatory response and damage the surrounding tissue. NETs have been associated with various conditions, including autoimmune diseases, vascular disorders, and other inflammatory states.
Research into NETs and their role in immune defense and disease processes is an active area of medical research. Targeted modulation of NETs could potentially offer new approaches for the treatment of infections and immune-mediated disorders.
Pseudo-Gaucher cells, also known as pseudo-Gaucher macrophages or pseudo-Gaucher cells, are a type of cells observed in certain medical conditions that resemble the appearance of cells seen in Gaucher disease. However, unlike true Gaucher cells, pseudo-Gaucher cells do not represent the accumulation of glucocerebroside, which is characteristic of Gaucher disease.
Pseudo-Gaucher cells are typically macrophages that contain lipid-laden vacuoles, giving them a similar „wrinkled tissue paper“ or „crumpled silk“ appearance as seen in Gaucher cells. These cells can be identified through microscopic examination of affected tissues or fluid samples.
Pseudo-Gaucher cells can be found in various conditions, including lysosomal storage disorders other than Gaucher disease, such as Niemann-Pick disease, Tay-Sachs disease, and other lipid storage disorders. Additionally, they can be observed in certain non-lysosomal storage disorders and inflammatory conditions.
The presence of pseudo-Gaucher cells can be helpful in the diagnostic process, as their identification may suggest the need for further evaluation to differentiate between different diseases. However, it is important to note that the presence of pseudo-Gaucher cells alone is not diagnostic of a specific disorder and further testing is usually required for an accurate diagnosis.
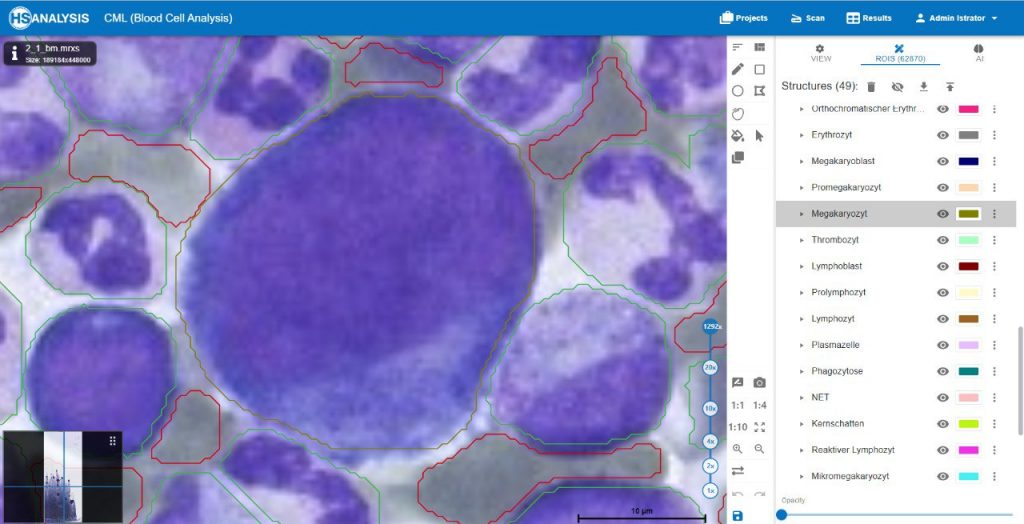
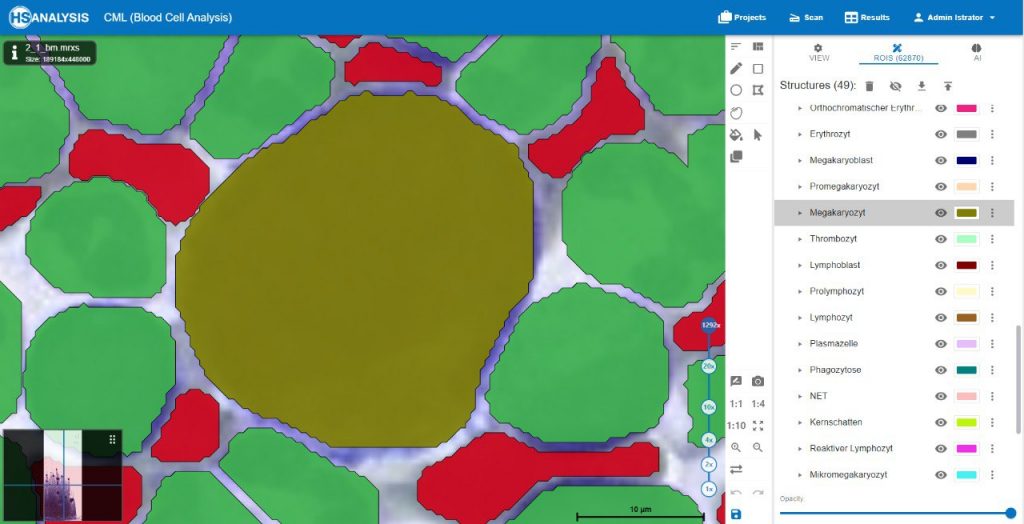
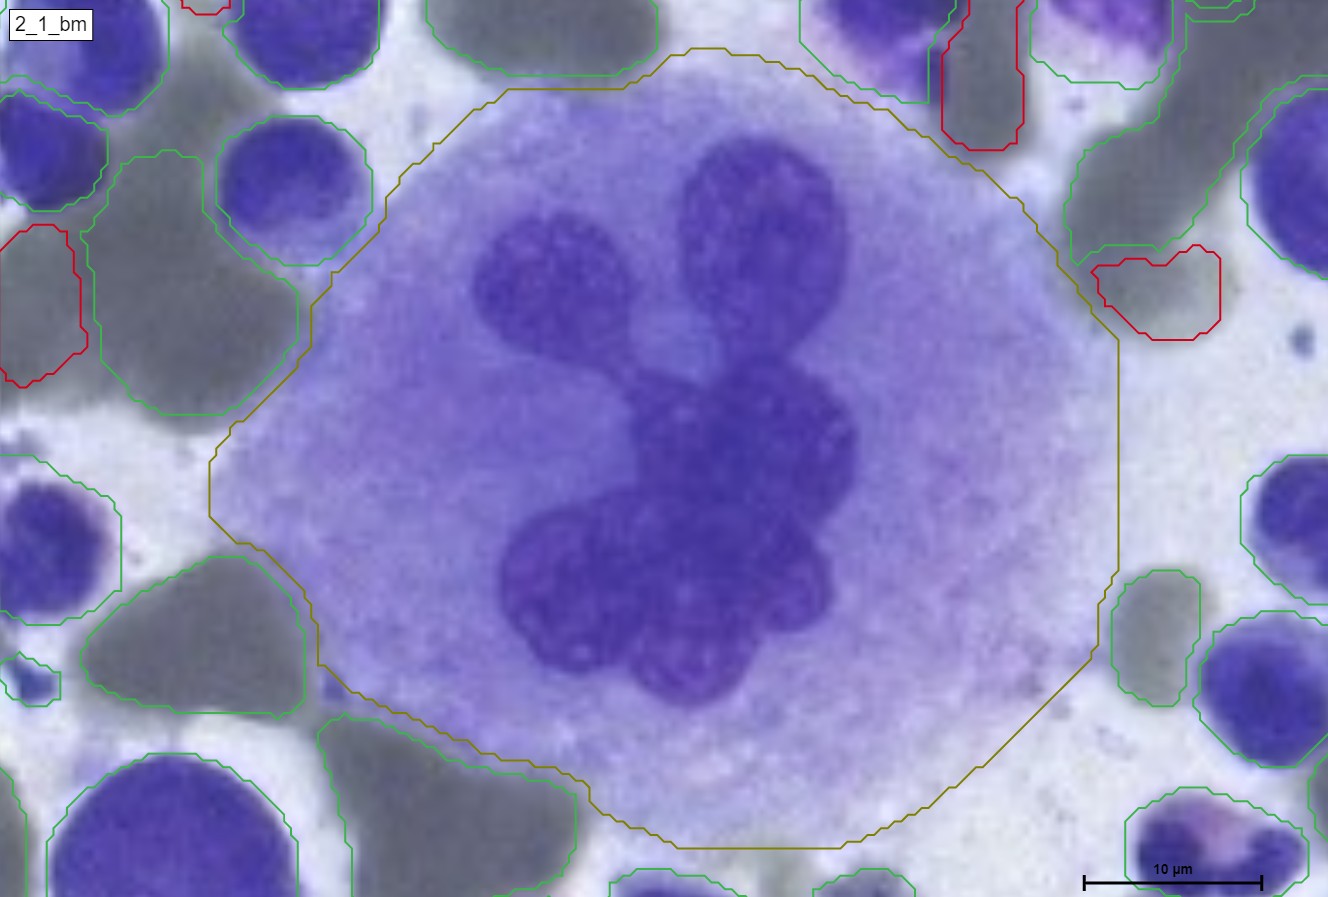
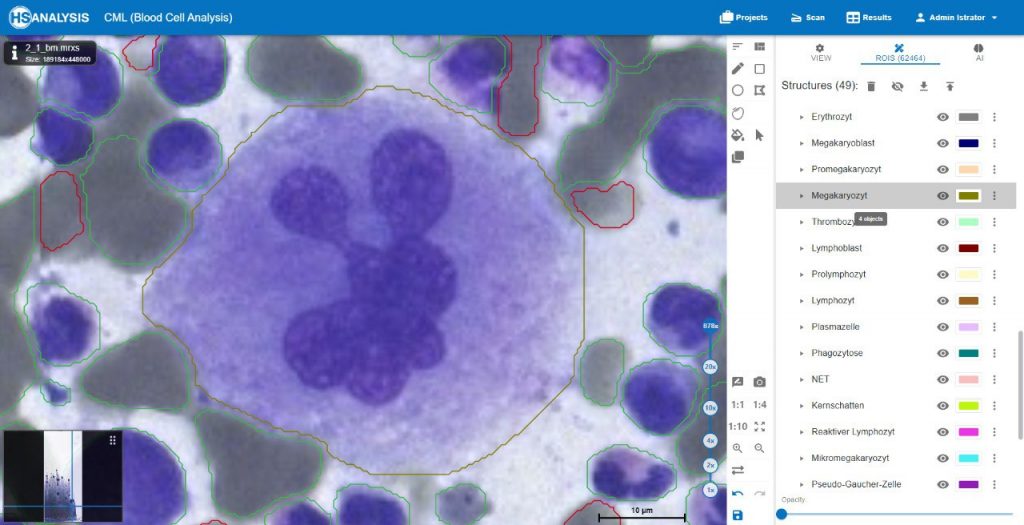
A megakaryocyte is a large bone marrow cell that is responsible for the production of platelets, which are essential for blood clotting. Megakaryocytes are part of the hematopoietic cell lineage, specifically the myeloid lineage.
Megakaryocytes are unique in their appearance and structure. They are large, multinucleated cells, meaning they have multiple nuclei within a single cell body. The nuclei of megakaryocytes undergo endomitosis, a process where DNA replication occurs without cell division, resulting in a polyploid cell with multiple sets of chromosomes.
Within the bone marrow, megakaryocytes reside in specialized areas called megakaryocyte islands or niches. These niches provide an environment conducive to platelet production. Megakaryocytes extend long, branching cytoplasmic projections called proplatelets into blood vessels, where they undergo fragmentation to form platelets. Each megakaryocyte can produce numerous platelets, which are released into the bloodstream to perform their crucial role in clotting.
Megakaryocytes are regulated by various growth factors and hormones, such as thrombopoietin, which stimulates their development and maturation. Abnormalities in megakaryocyte production or function can result in platelet disorders, such as thrombocytopenia (low platelet count) or thrombocytosis (high platelet count).
The study of megakaryocytes and their role in platelet production is important in understanding disorders of blood clotting and developing treatments for related conditions.
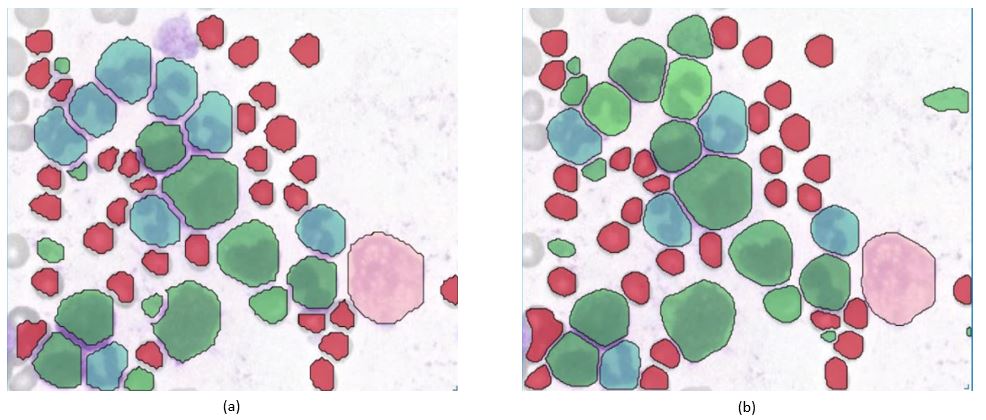
Figure (a) shows a Modell that was trained with the Mask-R-CNN Framework. Figure (b) shows a Modell that was trained with the Vision-Transformer Framework. Both modells achieve really good results in the classification of Blood Cells. Furthermore these models are also able to detect „Segmentkernige Granulozyten“ (blue-green) and „Stabkernige Granulozyten“ (light-green).
Segmented neutrophils (also known as segmented or segmented neutrophilic granulocytes) and band neutrophils (also known as band or stab neutrophilic granulocytes) are two types of mature neutrophils, which are a type of white blood cell involved in the immune response against bacterial infections.
Segmented neutrophils, also called segmented or segmented neutrophilic granulocytes, are fully mature neutrophils. They are characterized by a segmented nucleus, which appears as two or more distinct lobes connected by thin strands of nuclear material. These lobes give them a segmented or „polymorphonuclear“ appearance, hence the name. Segmented neutrophils make up the majority of circulating neutrophils in the blood and are the most common type of white blood cell.
Band neutrophils, also referred to as band or stab neutrophilic granulocytes, are immature or slightly less mature forms of neutrophils. They have a nucleus that is not yet fully segmented and appears as a band or rod shape without distinct lobes. The nucleus of a band neutrophil is elongated or curved, giving it a „band-like“ appearance. Band neutrophils are typically seen in increased numbers during acute infections or inflammatory conditions, indicating an increased demand for neutrophils in the body’s immune response.
Both segmented and band neutrophils are granulocytes, which means they contain granules within their cytoplasm. These granules contain enzymes and proteins that play a role in the neutrophils‘ immune functions, such as phagocytosis (engulfing and destroying pathogens) and releasing antimicrobial substances.
The presence and ratio of segmented and band neutrophils in the blood can provide valuable information to healthcare professionals, as changes in these levels can indicate various conditions, including bacterial infections, inflammation, or other underlying health issues.
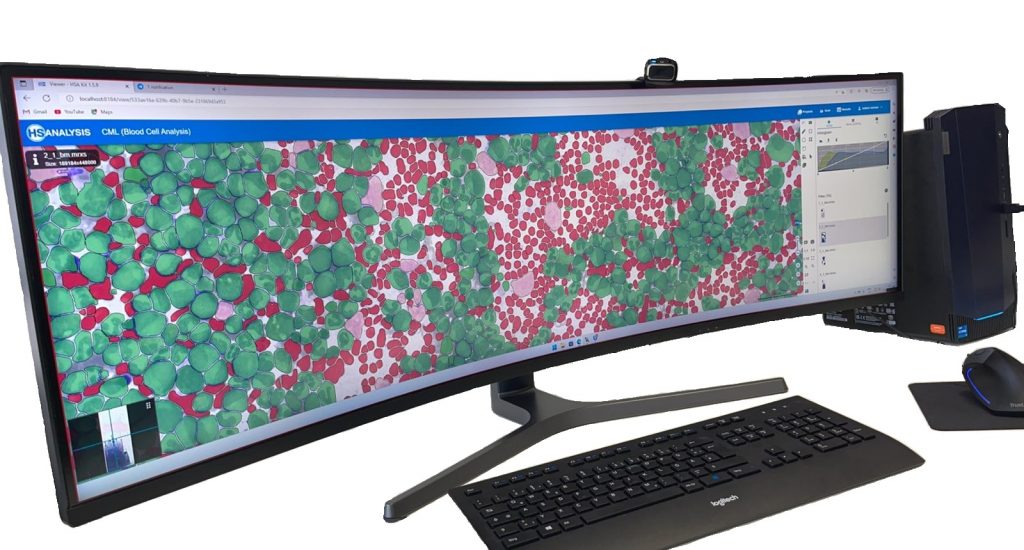
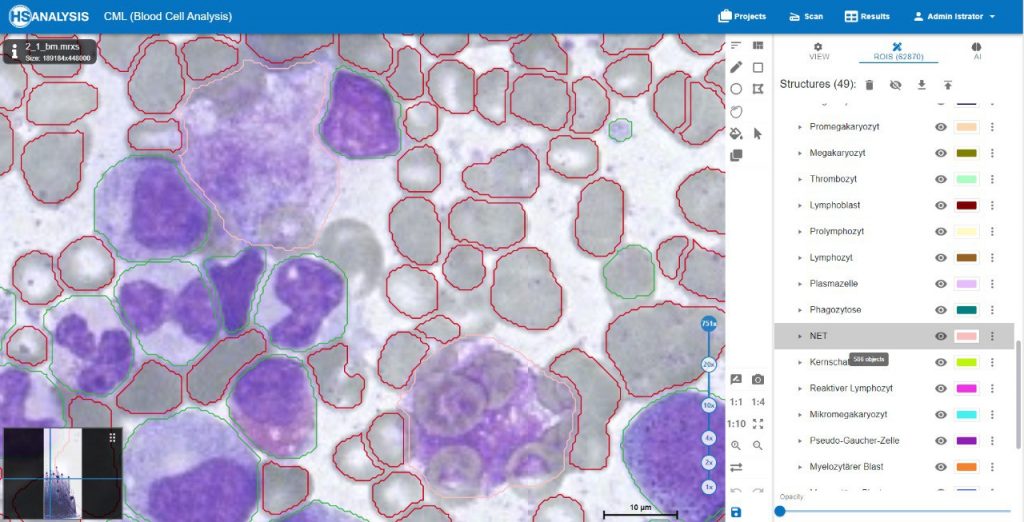
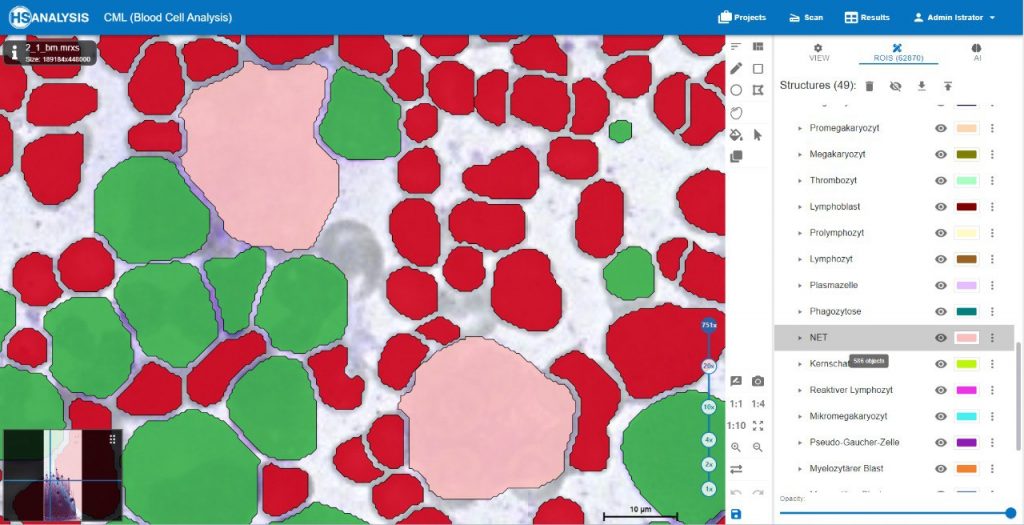
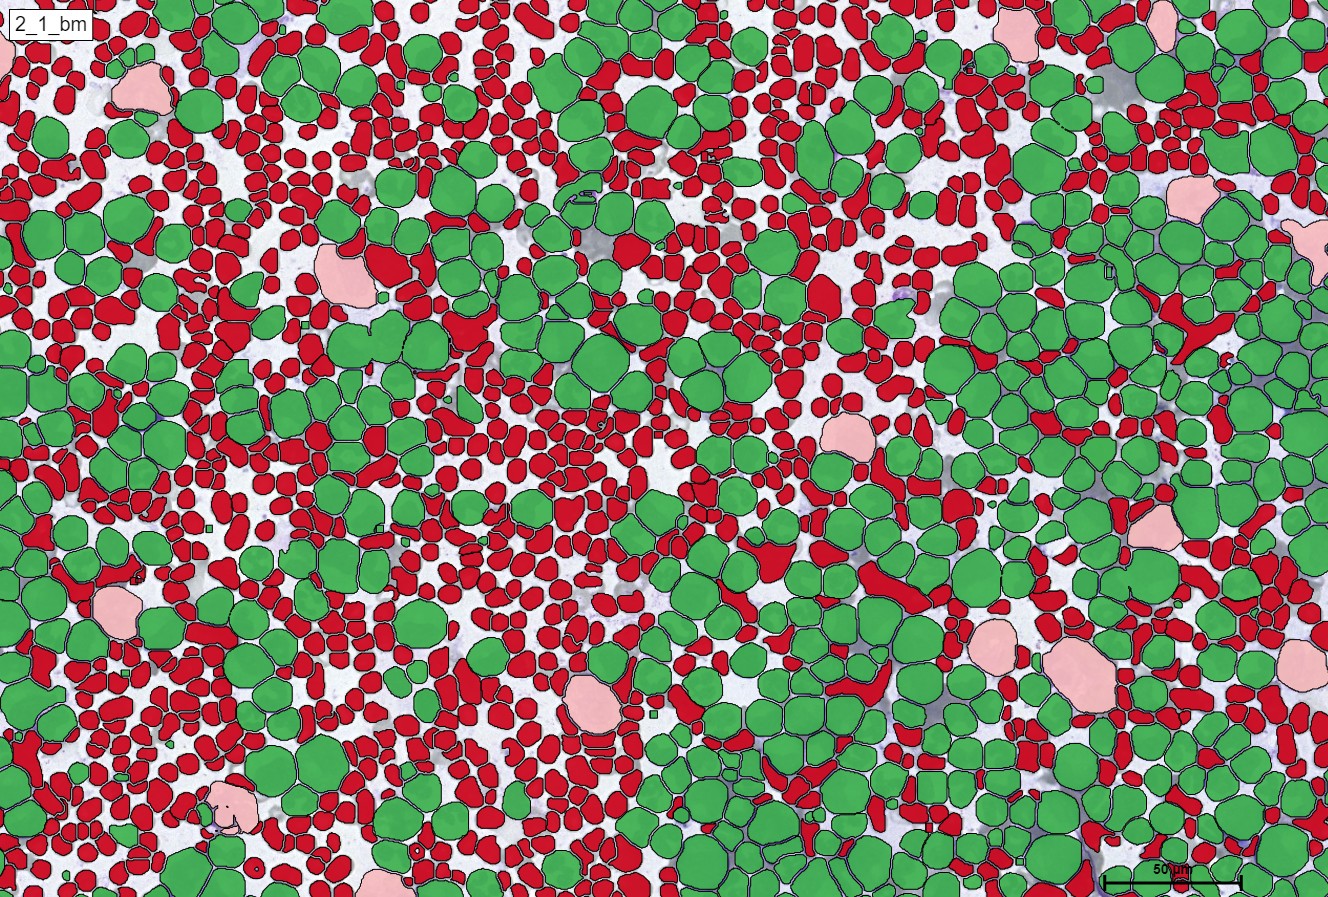
For a better and more interactive viewing, you can move the slider from left to right as well as zoom in and out to see the true supreme cell detection quality that our HS Analysis KIT can do on a small portion of a much larger whole slide picture of CML that was able to differentiate types of cells and detected the exact diameter of each cell. Below you can see the before and after CML healthy\un-healthy cell annotation using the automated deep learning instance segmentation HS Analysis KIT model.
Furthermore, in terms of classes, we can see the many different classifications of the un-healthy cells that are detected by the HS Analysis software, just like the other annotations, these classes must first be annotated as well before they are trained with the deep learning model, there are 40+ CML classes that the HS Analysis KIT can learn from and it differentiates by its names and colors of the annotated structure, for example they range from the young\old Megakaryozyt to the very common and thin spiders web like NET.
The main treatment for chronic myeloid leukemia is a tyrosine kinase inhibitor (TKI). Research facilities and pharmaceutical companies can test whether TKIs promote or decrease the formation of NETs, which are obtained from CML patients.
The quantity of mature\immature Megakaryozyt known as blasts, can determine which of the 3 phases the CML patient is currently in.
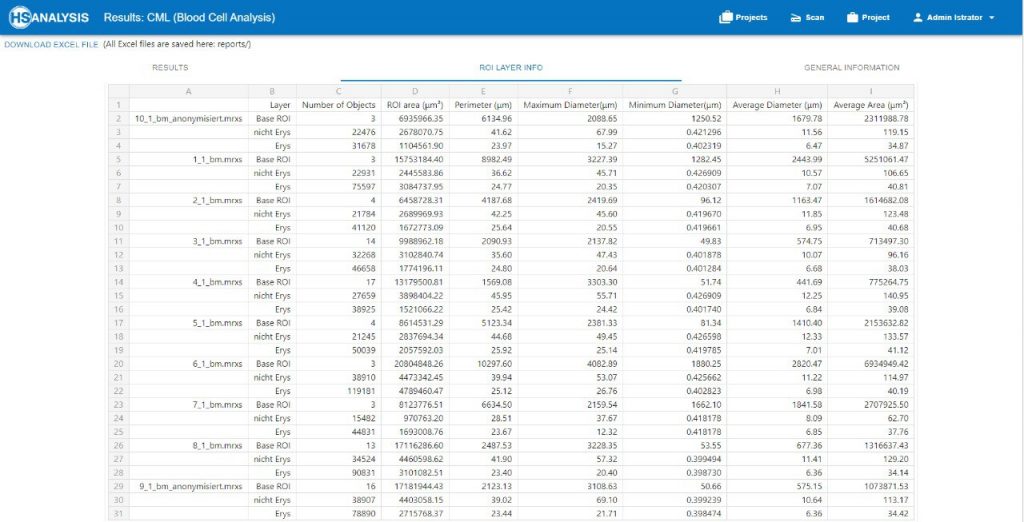
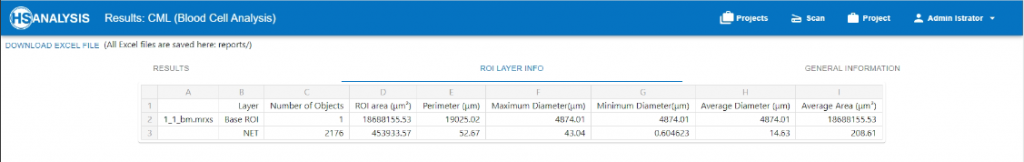
In terms of lab results, after the model is trained and ran the entire project, the HS Analysis software provides us with the information we need to understand the severity and condition in a sheet format, such as the name of the files, number of objects (structures) such as healthy and un-healthy cells, the classes of the un-healthy cells, dimension of the analyzed areas such as square meter and diameter of cells sizes and their average, etc…
Or we can specify the deep learning analyzation of a single structure like Healthy cells or one\multiple of its sub-structures such as Neutrophil Extracellular Trap (NET)s
By utilizing the proprietary deep learning HS Analysis software and its lab result, Doctors can have an ease in mind knowing that these accurate results can assist in making decisions for patients that suffer from Chronic myeloid leukemia or a research center that are seeking for a better insight into Chronic myeloid leukemia.
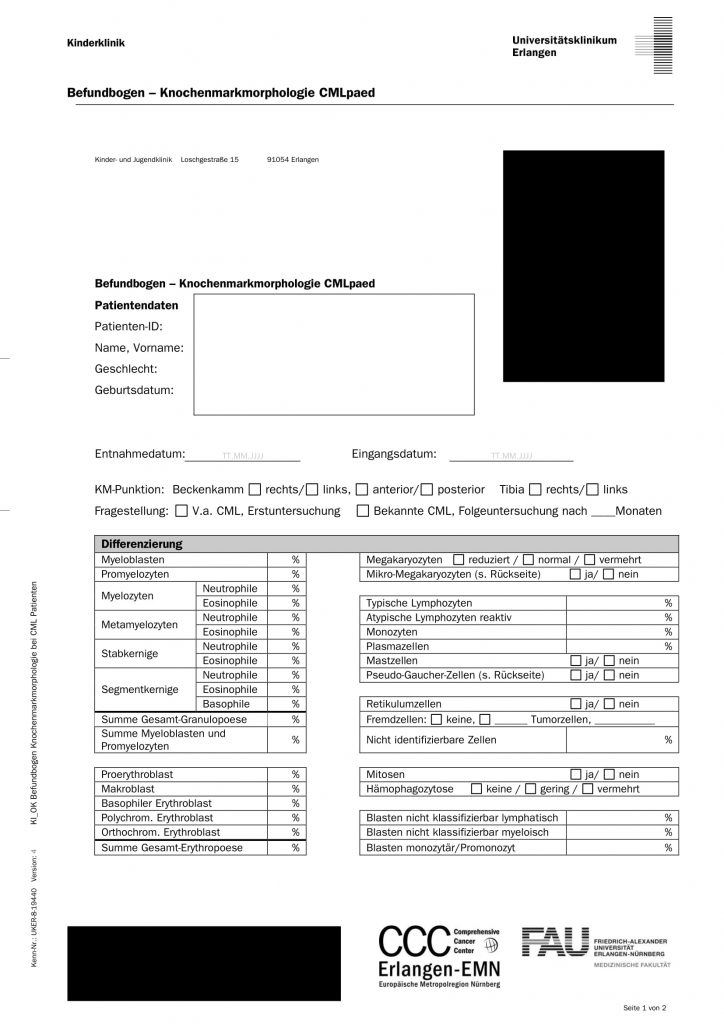
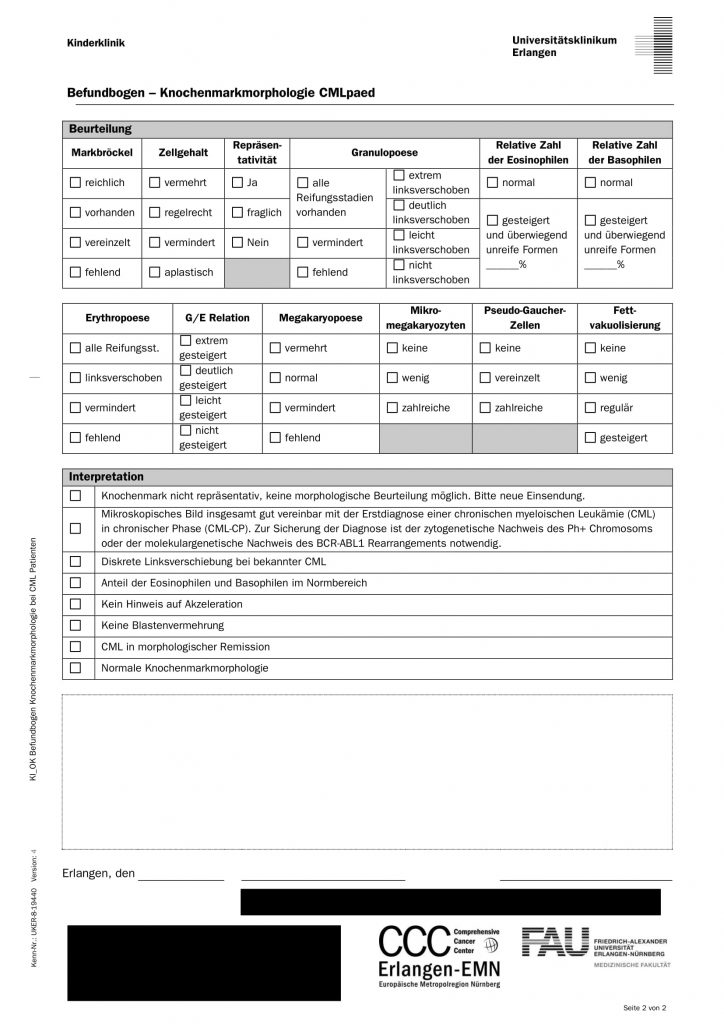
The report bone marrow morphology CMLpead will be perfectly integrated as a digital report into the Software HSA KIT. The numbers from the quantification with HSA KIT will be written into the report and are the basis for the evidence based medicine. Based on this report the doctors get an AI assistant and suggestions to the possible development and status of patient.
CML patients can rest easy knowing that the collaboration of the physicians and medical researchers at Universitätsklinikum Erlangen and the specialists in image analysis and artificial intelligence In digital pathology at HSA will make the route to discovering better medicine much more advanced and not to mention reducing the rate of mortality in chronic myeloid leukemia.
Most advanced instance segmentation for CML worldwide:
The software HSA KIT includes HyperCMLNet, the most advanced instance segmentation for CML worldwide. HyperCMLNet as deep learning technique was developed at HS Analysis GmbH and based on Mask R-CNN and Vision Transformer (ViT).
In the software HSA KIT data scientists not only create and manage high quality ground truth data or train and manage corresponding deep learning models, they also are able to compare the models with metrics as well as overlays.
You can see below the metrics of the first HyperCMLNet (type 1) based on Mask R-CNN as well as the second HyperCMLNet (type 2) based on Vision Transformer (ViT). The HyperCMLNet in the first step separate erythrocyte from leukocytes and in the second step separate all the classes from leukocytes. The doctors are able to detect fully automatically all the classes of CML e.g. NET, Pseudo-Gaucher-Zelle and Megakaryozyt, etc. as well as erythrocyte. The classes were trained on 137,834 GTD. These models were evaluated using both metrics mAP and loss in the software HSA KIT.
Creation of Ground Truth Data
In order to train a model in deep learning (GTD) is needed which is accomplished by simply creating Base ROIs and annotating the existing cells within the Base ROIs. The number of cells in the GTD form that is available (see Tab.1) were 10 files along with + 800,000 GTD utilizing the HSA KIT proprietary software. There are various phases involved in creating the GTD. The Carl Zeiss Image Data File contains a WSI file, which is first loaded into the HSA KIT (CZI). The annotations are set within the ROI with regard to a function of the HSA KIT. Then the blood cells structure are annotated and this structure has 2 sub-structures which are erythrocyte and leukocytes, the leukocytes is further divided into 45 different classes including (NET, Pseudo-Gaucher-Zelle and Megakaryozyt) and the quantity of the classes are (5399, 97 and 149) respectively. The quantity and quality of these annotations depends on the location, clarity and size of the base ROI. Below is a breakdown of the class distribution along with the corresponding percentages.
| Classes | leukocytes | erythrocyte | Megakaryozyt | NET | Pseudo-Gaucher-Zelle | Segmentkernige Granulocytes | Stabkernige Granulocytes |
| All data | 274,553 | 617,709 | 149 | 5,399 | 97 | 4194 | 1678 |
| Used data | 48,887 | 88,947 | 59 | 4,587 | 93 | 4194 | 1678 |
Framework
The Deep Learning (DL) model creation framework PyTorch has grown to be very popular and effective. This Torch-based open-source machine learning library was created to boost deep neural network implementation speed and flexibility. PyTorch is a Torch and Python-based Deep Learning tensor library that is mostly utilized in CPU and GPU applications. Torch is an open-source ML library used for creating deep neural networks and is written in the Lua scripting language.
Selection of the data set
After creation of GTD, the following tables was used in the 3 Class AI model training and the erythrocyte and leukocytes AI model training:
| Model Type | Epochs | Learning Rate | Batch Size | Tile Size |
| Instance Segmentation | 100 | 0.0001 | 2 | 512 |
| Model Type | Epochs | Learning Rate | Batch Size | Tile Size |
| Instance Segmentation | 50 | 0.0001 | 1 | 256 |
Interpretation and validation of result
The following data will show the comparison of both loss and mAP evaluations on the instances segmentation results that was performed by both of the trained (type 1 & 2) of the HyperCMLNet architectures for erythrocyte and leukocytes and the 3 classifications. The following table shows the actual obtained results from the model training.
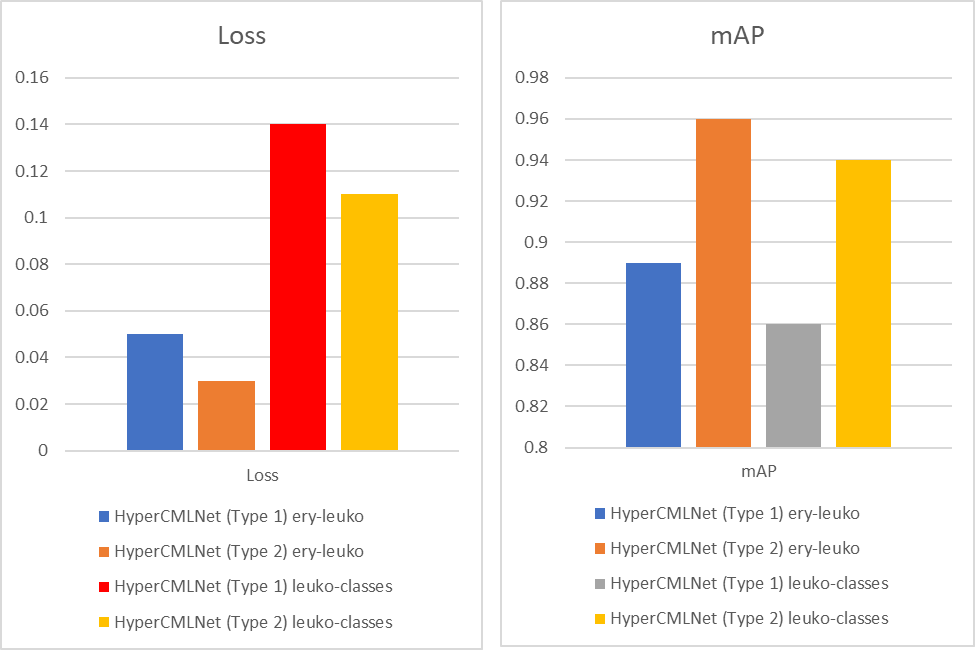
In the case of Loss, which is a function that requires to be decreased in order to have an ideal deep learning model. The loss value would produce a huge number if its predictions diverge too much from the actual results. The graph shows that the HyperCMLNet which is based on Mask R-CNN (Type 1) has a lower Loss when compared to the(Type 2) ViT based HyperCMLNet. We can see that the HyperCMLNet (Type 1) based on Mask-R-CNN has the loss metrics values of 3% and 11% when compared to the higher loss metrics values of HyperCMLNet (Type 2) based on ViT which are 4% and 13%. So in terms of Loss, the HyperCMLNet (type 1) has the best Loss evaluations out of both types.
In the case of mAP, the accuracy of the instance segmentation detection is measured using mean average precision (mAP), another performance evaluation metric. Thus, the outcomes of instance segmentation will be more accurate the higher the mAP value. The graph also shows that this time the HyperCMLNet (Type 2) based on ViT has superior mAP values being at 94% and 96%, when compared to the lower mAP values produced by the HyperCMLNet (Type 1) based on Mask R-CNN which are 86% and 89%. So in terms of mAP, the HyperCMLNet (type 2) has the best mAP evaluations out of both types.
Visual interpretation of the results:
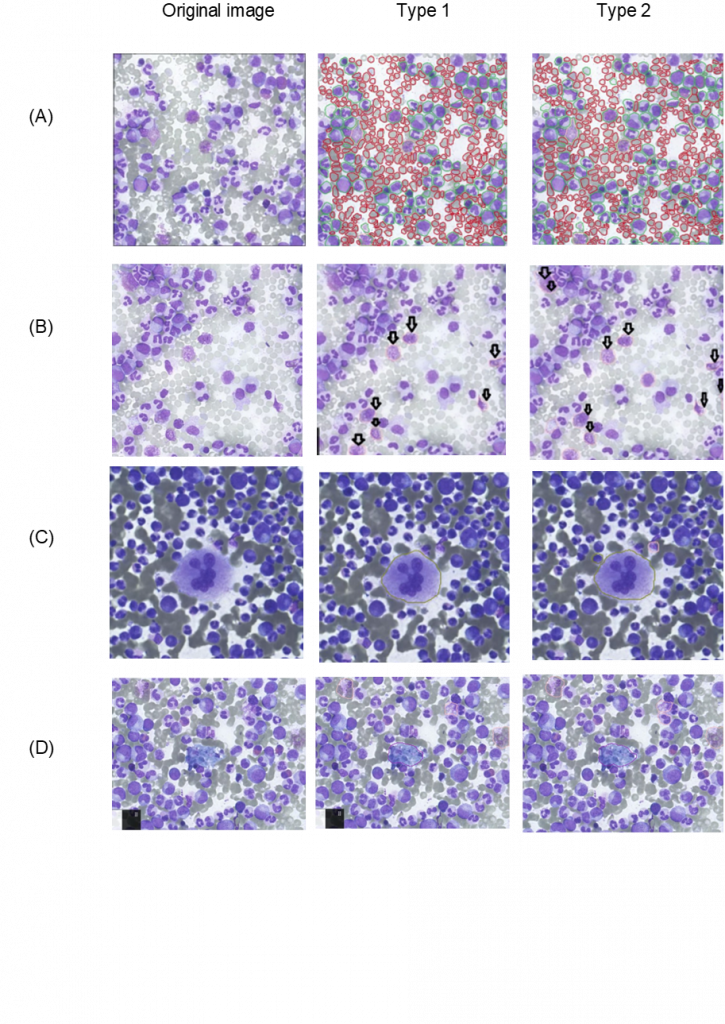
After the AI training is finished for any model, it always ends in giving the user mathematical results such as graphs or numerical results. Although they are important, another determination of the quality of the AI model is done by checking the detection manually. Which leads us into this section of visual interpretation of the results, and this section illustrates the visualization the instance segmentation of both of the (type 1 & 2) AI models of the CML images, the following figure shows multiple images are showing the original and the (predictions) determined by the networks.
The images of cell detection acquired from model trainings in the accompanying figure ((A) Erythrocyte and Leukocytes, (B) NET, (C) Megakaryozyt, and (D) Pseudo) demonstrate that both (types 1 & 2) of HyperCMLNet have very similar detection. First off, as the name suggests, the original picture column displays the untrained, raw, and cell-detection-free portion of the CML image. The HyperCMLNet trained model has been applied to some of the Base ROIs shown in the second column (Type 1). These Base ROIs display the detection of erythrocytes and leukocytes as well as the substructures of leukocytes.
Thirdly, the (Type 2) HyperCMLNet trained model is displayed in the third and final column and was applied to the identical Base ROIs as the (Type 1) model. When type 1 and type 2 are compared in terms of erythrocytes and leukocytes, both models exhibit excellent detection of erythrocytes and leukocytes, possessing a high level of detail and detection boundaries.
The HyperCMLNet architecture’s brilliance was able to distinguish the error prone when detection of the separation of some mashed-up erythrocyte cells as well as leukocytes, even though their error occurrence is less likely because they have a significantly smaller area especially in comparison to erythrocyte. This project was both large and complex. In order to distinguish between closely spaced erythrocyte cells, the HyperCMLNet was able to deliver its findings in a clear and understandable manner.
Again, the quality is remarkable in both (type 1 & 2) of the HyperCMLNet designs when comparing the (type 1 & 2) models in terms of NET identification. It has the ability to ignore non-NET cell detection and focus only on NET cell detection.
Types 1 and 2 are contrasted with Megakaryocyte and Pseudo. Both (type 1 & 2) seem to detect Megakaryocyte and Pseudo with high precision and accuracy in all files and delivering outstanding detection. This is because both (type 1 & 2) employed high volumes of data for the HyperCMLNet (type 1 & 2) training. However, in all most all cases, the HyperCMLNet (type 2) showed a bit more attention to detail when detecting the CML structures when compared to the HyperCMLNet (type 2). The figure below shows the visualization of the training results of both types of HyperCMLNet.
HSA KIT’s Advanced Heatmap tool:
The enhanced heatmap tool detection that was utilized in HSA KIT will be employed in this section to compare the outcomes of the CML classes to one another. The advanced heatmap tool in the HSA KIT is used to detect the forecasting where the classes of the AI models are most likely to be located. The warmer (more red) the heatmap, the higher the probability of the detection; conversely, the colder (more blue), the less likely the detection prediction will occur.
In essence, the hotspot of AI-generated annotations is visualized using the sophisticated heatmap tool. It is designed for AI visualization projects like the one used here that produces the findings with a lot of detail displayed on a single slide.
The HyperCMLNet-ViT (Type 2) and HyperCMLNet-Mask-R-CNN (Type 1) architectures are used in the first column and the erythrocyte, leukocyte, and (B, C, and D) leukocyte classes, respectively, in the second column of the following figure.
We can’t really say which of the two architectures in (A) is more ideal because there isn’t much of a difference between them in terms of advanced heatmap detection of erythrocyte and leukocyte mother structures, but both architectures have great hotspot predictions.
When it came to (B, C, and D), the detection quality for both designs was comparable and yielded encouraging results, although they shared a lot of the same traits when it came to precise and accurate heatmap detection..
With the help of the advanced heatmap tool in the HSA KIT, the localization of the heatmap prediction can be further enhanced by adding more GTD. The advanced heatmap tool also offers the ability to set the intensity slider so that we can view the heatmap at various intervals and fully appreciate the revolutionary detection of the HyperCMLNet architecture. The figure below shows the visualization of HSA KIT’s advanced heatmap tool for the training results of both types of HyperCMLNet.
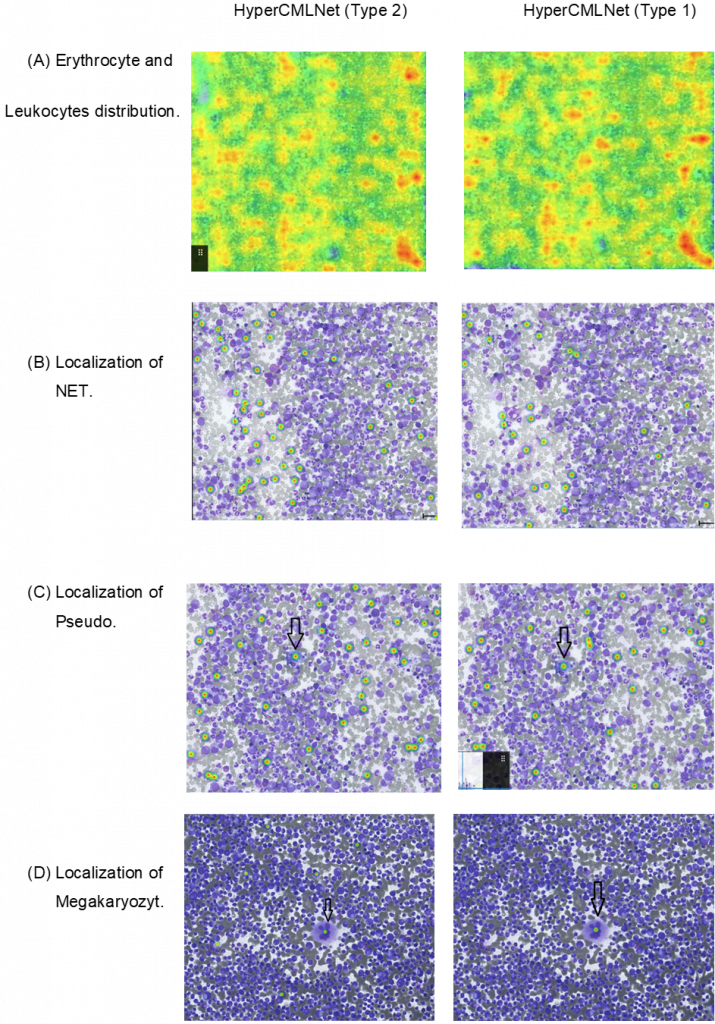
In this figure, the mother structures (erythrocyte, leukocytes) and the 3 sub-classes of the leukocytes (NET, Pseudo-Gaucher-Zelle and Megakaryozyt) of chronic myeloid leukemia were detected using deep learning models and then were calculated and validated. In addition, HSA KIT’s heatmap tool was used to visualize these models to determine how the same cells classes with different architecture were recognized. HyperCMLNet (type 1) which is based on the Mask R-CNN architecture and HyperCMLNet (type 2) which is based on the Vision Transformer architecture were both implemented on GTD of CML. The aim of was to compare the detection multiple classes of CML on both architectures in instance segmentation in deep learning.
Digitalization of histological slides and analysis with HSA KIT
HSA imports and works with 3dhistech and mirax files created by the Hamamatsu slide scanner. They are a perfect match for the HSA KIT.
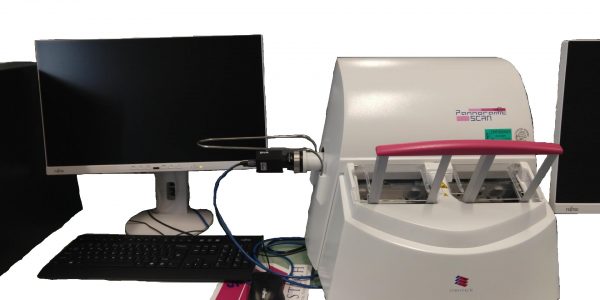
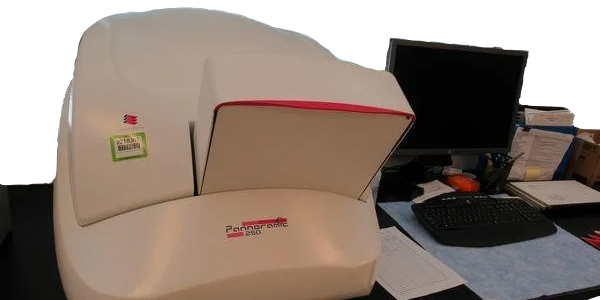
If you don’t have a slide scanner and want to get one later, you can manually digitalize the slides on your microscope and create manual WSI using our inexpensive and affordable software (HSA SCAN M).
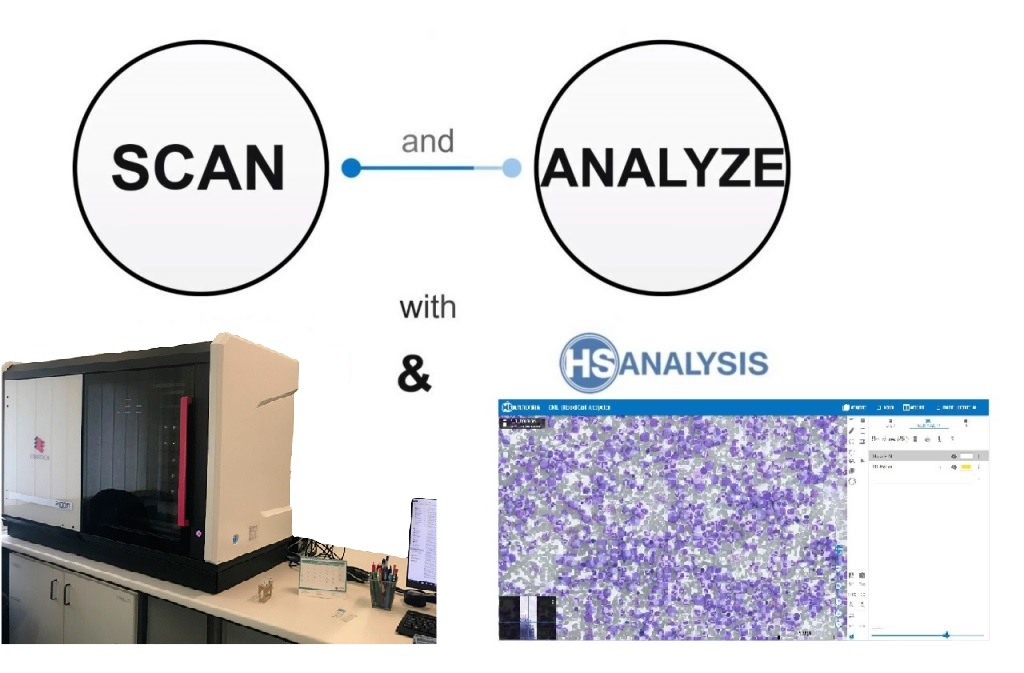
The software’s user-friendly interface allows for easy navigation and customization of scanning settings to meet specific needs. Additionally, the integration with HSA KIT software allows for advanced image analysis and interpretation, providing valuable insights for research and diagnosis. Overall, HSA SCAN M software offers a comprehensive solution for labs seeking to streamline their slide digitization process while maintaining quality control. A glimple of how to manually scan slides with HSA SCAN M
To automatically scan the slides, the existing microscope can be upgraded to an automated microscope station (HSA SCAN A) for low-cost, high-quality performance in a short period of time.
HSA only requires the dimensions of the microscope and any specifications to include, and a custom-fit stand and motor for the microscope will be delivered. This solution eliminates the need for manual adjustments and ensures consistent results.
This will help in:
- Scanning accurately and quickly
- Keeping budget in check: Less expensive than automatic scanners
- Saving time: Automates tasks that require manual intervention
- Better workflow and quality results: reduced risk of errors or inconsistencies
- Intuitive, user friendly controls: Anyone with limited experience with microscopes can operate
A glimpse of intcorporating HSA KIT into routine analysis procedures, bringing more accurate and precise results; while also saving time and resources.
In this video, you can see manual scanning that converts a slide to a file with HSA SCAN software so that it can be trained and then automatically detected by a trained AI model using HSA KIT software.
If you want to automatically scan the slides, you can upgrade your microscope to an automated microscope station (HSA SCAN A). This converts your microscope into an automatic scanner for low-cost, high-quality performance in a short period of time.
HSA only requires the dimensions of your microscope and any specifications you wish to include, and we will send a stand and motor for your device that fits your microscope.
This will help you in:
- Scanning faster
- More accurate scanning
- Saving time
- Low budget
In above video, you can see an example of automatic scanner (HSA SCAN A). Do not hesitate to contact us for further information or ordering.
For more information or ordering : sales@hs-analysis.com
Note: This website will be updated in future. More CML healthy cells sub-structures will be added to the modules.