AI-assisted haematology analysis has the potential to completely change how blood illnesses are identified and treated. Large amounts of data may be swiftly and correctly analysed by AI algorithms, which can aid in the early detection of blood problems, result prediction, and selection of the most effective treatments.
The study of blood smears is one example of how AI is utilised in haematology. Hematologists typically use a microscope to detect and count the various blood cells present in blood smears. Machine learning algorithms can quickly and accurately identify various blood cell types and abnormalities, such as sickle cell anaemia or malaria, using digitised images of blood smears. This can enhance patient outcomes and aid in the early diagnosis of blood diseases.
The analysis of genetic data is another way that AI is used in haematology. AI algorithms can find genetic changes that might be causing the disease by examining the genetic makeup of people with blood issues. AI algorithms can detect genetic alterations that may be influencing the development of blood illnesses by examining the genetic composition of patients who have them. This can assist in creating individualised treatment regimens that focus on the disorder’s underlying genetic cause.
A common blood test called a CBC (Complete Blood Count) is used for evaluating a person’s general health and screen for a number of diseases, including blood cancer. Red blood cells, white blood cells, and platelets are just a few of the different blood cell kinds and numbers that are identified by the CBC.
However, because CBC only offers a broad overview of the blood cells in the body and because blood cancer may not always result in appreciable changes in CBC results, it may not be sufficient to identify blood cancer. A diagnosis of some blood cancers, such as early-stage leukaemia or lymphoma, may not be confirmed by CBC alone and may necessitate additional diagnostic procedures.
Among other diagnostic procedures, bone marrow biopsy, flow cytometry, and genetic testing may be used to find blood cancer. These tests can assist in making a more precise diagnosis of the kind and stage of blood cancer, which is necessary for choosing the best course of action.
In conclusion, while CBC is a valuable blood cancer screening tool, it might not be sufficient to provide a conclusive diagnosis, and further testing might be necessary to confirm a suspected diagnosis.
Machine Learning
-Analysis
Tumours that affect the blood, bone marrow, and lymphatic system are referred to as haematological malignancies. Examples of these tumours include leukemia, lymphoma, and myeloma. By examining huge datasets of patient data, test findings, and medical imaging, machine learning (ML) algorithms can help with the detection and diagnosis of these malignancies. Here are some typical methods for utilising ML to find haematological malignancies:
- Image analysis: Machine learning algorithms can be taught to examine medical images like CT scans, MRIs, and PET scans to find patterns and abnormal cell proliferation that might point to haematological cancers. The type and stage of cancer can also be determined with the help of these algorithms.
- Biomarker analysis: Biomarkers are observable signs of a biological condition, such as the presence of particular proteins or genetic abnormalities. Large datasets of biomarker data can be analysed by machine learning algorithms to find trends that might point to haematological malignancies.
- Electronic health record (EHR) analysis: Electronic health records contain a wealth of information about patient medical history, lab results, and diagnostic imaging studies. It is possible to train machine learning algorithms to examine EHR data to find trends and risk variables that could be connected to haematological malignancies.
- Blood analysis: Blood samples can be analysed using machine learning algorithms to find aberrant cell populations or gene alterations that could be signs of haematological malignancies.
-Recurrence
For some types of blood cancer, such as chronic lymphocytic leukemia (CLL) and low-grade lymphoma, recurrence may occur years or even decades after initial treatment, while for other types, such as acute lymphoblastic leukemia (ALL) and aggressive lymphoma, recurrence may occur within months of treatment.
- Risk assessment: Machine learning algorithms can be trained to analyze patient medical records and identify risk factors that may increase the likelihood of developing a hematological condition or disease. This information can be used to develop personalized prevention and treatment plans.
- Disease detection: Machine learning algorithms can be trained to analyze medical images, such as blood smears or bone marrow biopsies, to identify abnormal cell growth patterns that may be indicative of a hematological condition or disease. This information can be used to facilitate early detection and intervention.
- Treatment response prediction: Machine learning algorithms can be used to analyze patient data and predict the likelihood of treatment success or failure based on factors such as disease stage, age, comorbidities, and genetic makeup. This information can be used to personalize treatment plans and improve patient outcomes.
- Disease progression prediction: Machine learning algorithms can be trained to analyze patient data and predict the likelihood of disease progression based on factors such as disease stage, age, and genetic makeup. This information can be used to develop personalized monitoring plans and adjust treatment plans as needed.
Patient survival rates can be greatly increased and fatality rates can be significantly reduced by early detection and prediction of hematological malignancies. However, the nature of data on medical treatments is complex, necessitating a thorough study to uncover key explicative aspects and hidden data patterns. Utilizing AI is the only method for managing massive sets.
HSA KIT
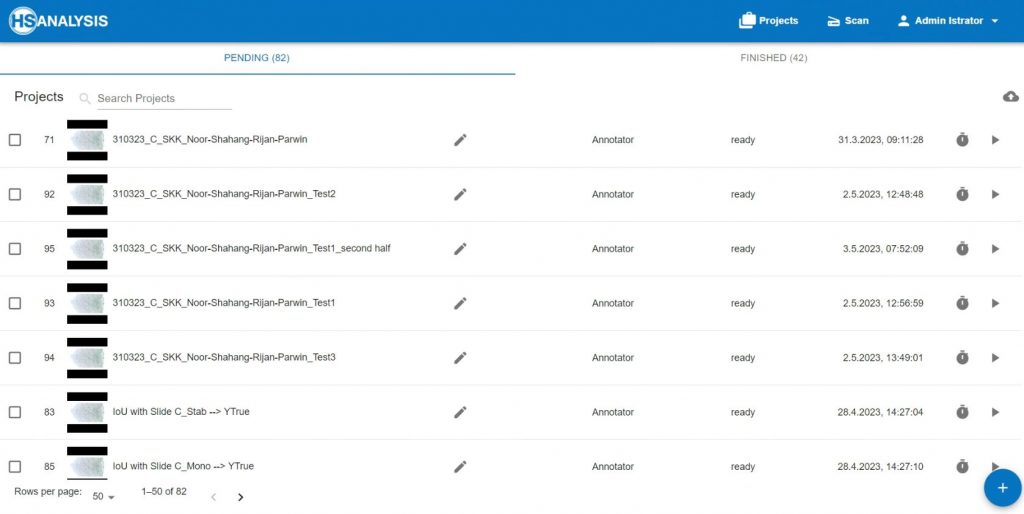
- Software developed specifically for AI as a digital assistant for evidence-based medicine
- No programming skills are required to use and train the AI
- Offline Deep Learning training possible
- User-friendly application interface
- Results are objective, traceable, reproducible
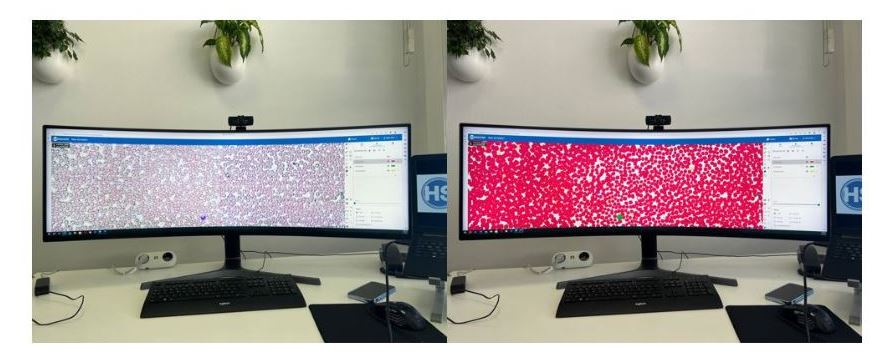
The company HS Analysis GmbH works closely with the central laboratory in the Städtisches Klinikum Karlsruhe to obtain blood smears that can be used to develop deep learning models. This collaboration makes it possible to develop a deep learning model (HyperHaemaNet Model) capable of recognizing and classifying all mature peripheral blood cells.
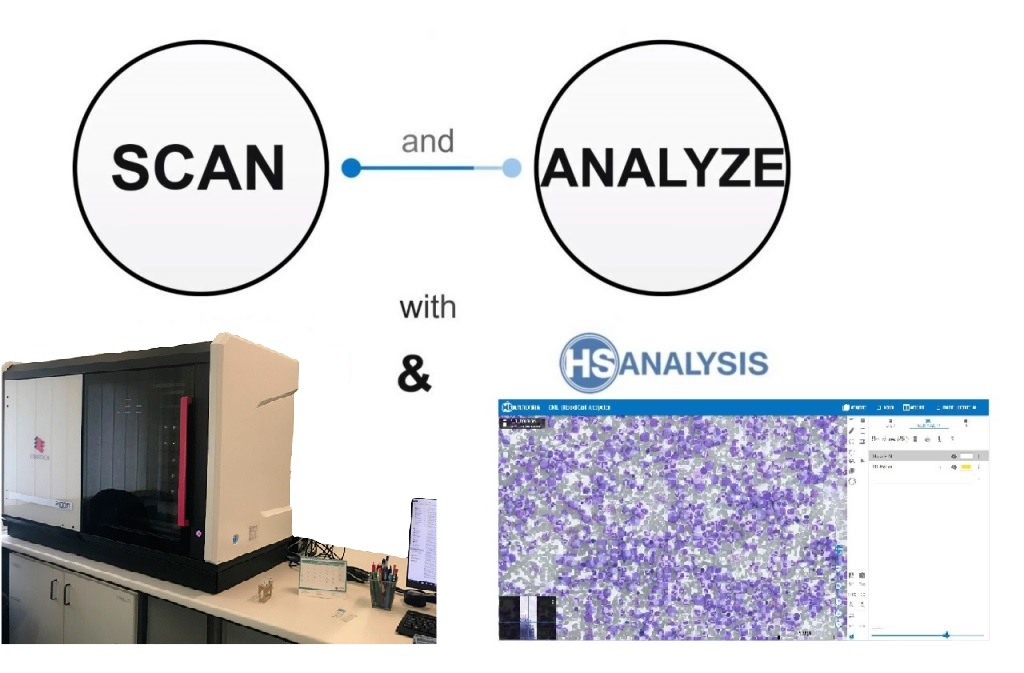
The blood smears are prepared by the employees of the central laboratory and picked up by employees of the company HS Analysis. After the blood smears arrive at the company headquarters, they are automatically digitized using the HSA software. The fully automatic HSA scanner already integrated in the HSA software is used for this. The scanner has a slide stage on which the blood smears can be placed. The stage was specially developed by HS Analysis to be able to scan blood smears/tissue samples fully automatically. The stage is controlled by an algorithm that controls all three axes (X, Y and Z axis). Thanks to the developed auto-focus function, the stage can adjust the sharpness of the image at any time.
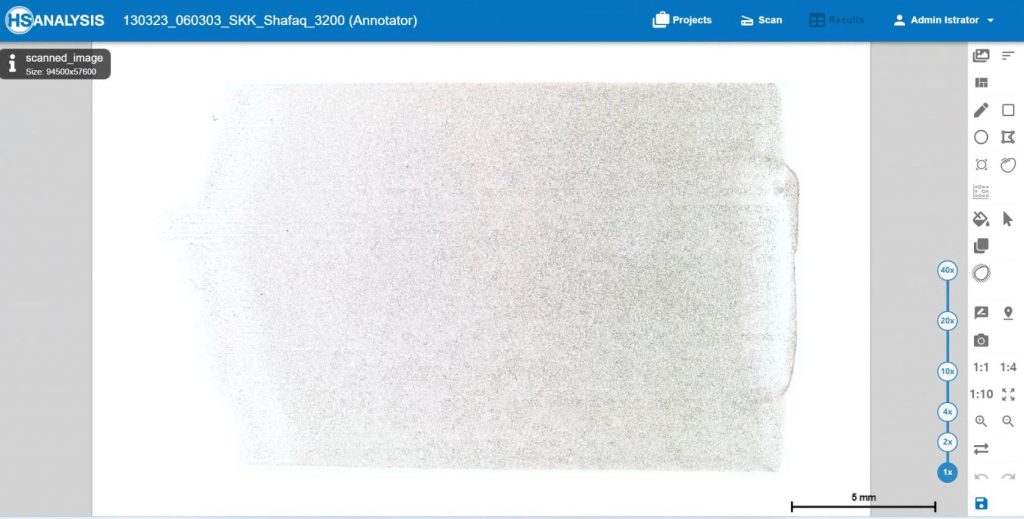
Digitalization of the slides
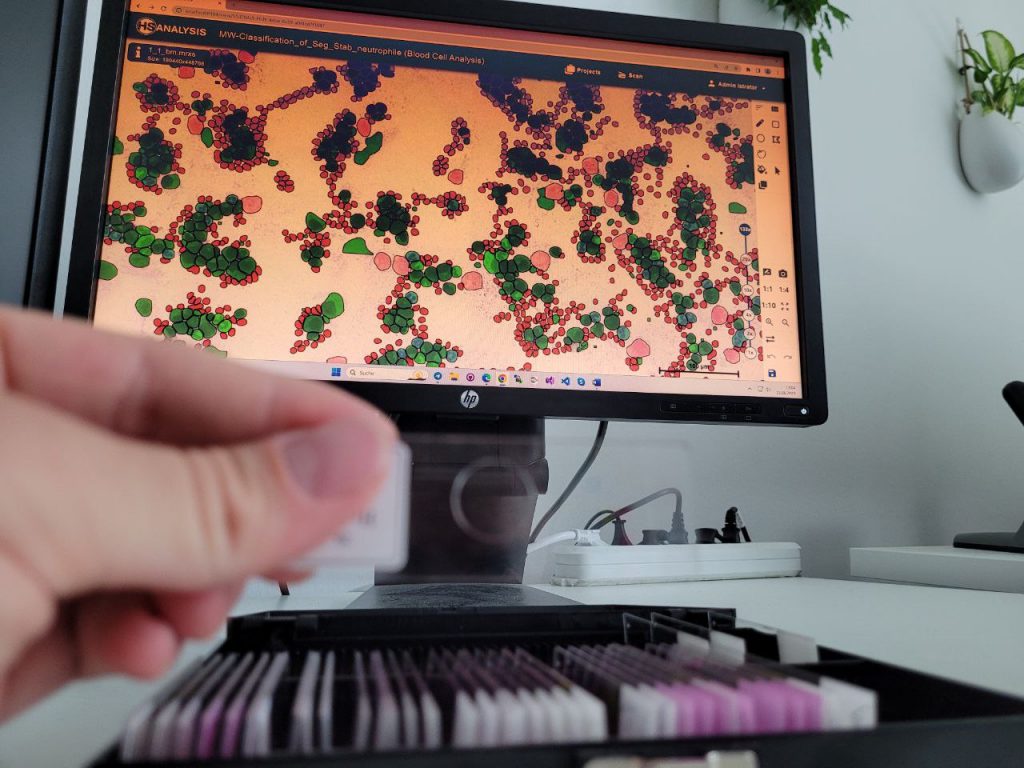
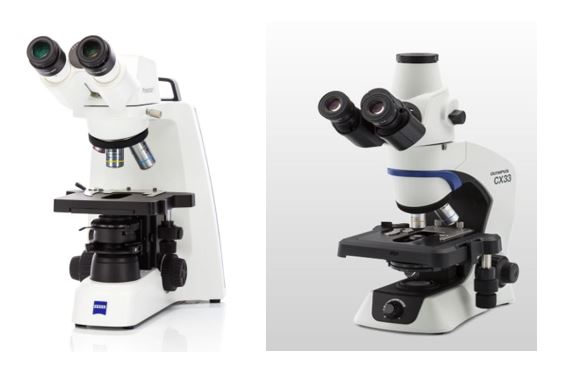
The digitalization of the slides is done with the software HSA SCAN, which was developed by the company HS Analysis GmbH. HSA SCAN turns physical slides into an digital file. Furthermore, the HSA SCANNER is used. This is a hardware product which upgrades an analog microscope to a digital microscope at low cost. The scan is performed with the Zeiss Primostar 3 microscope.

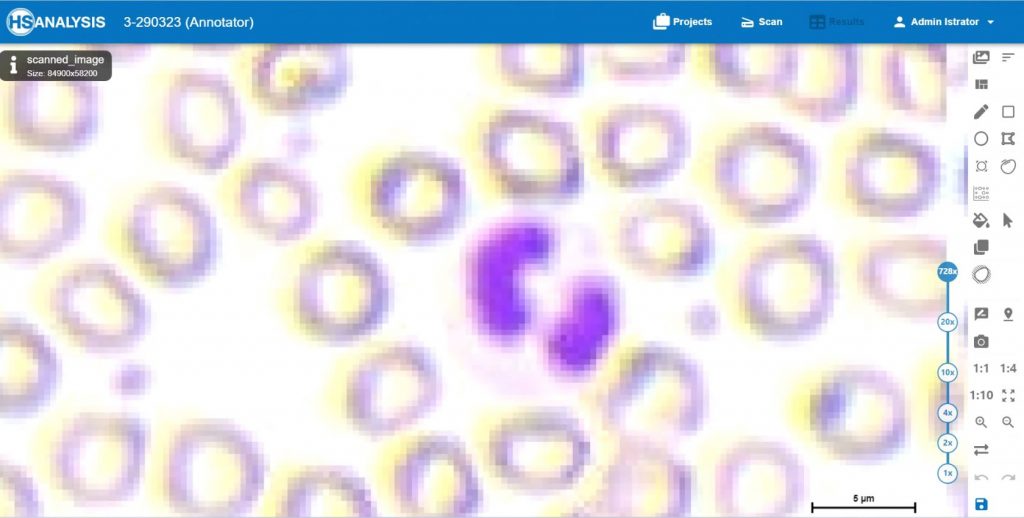
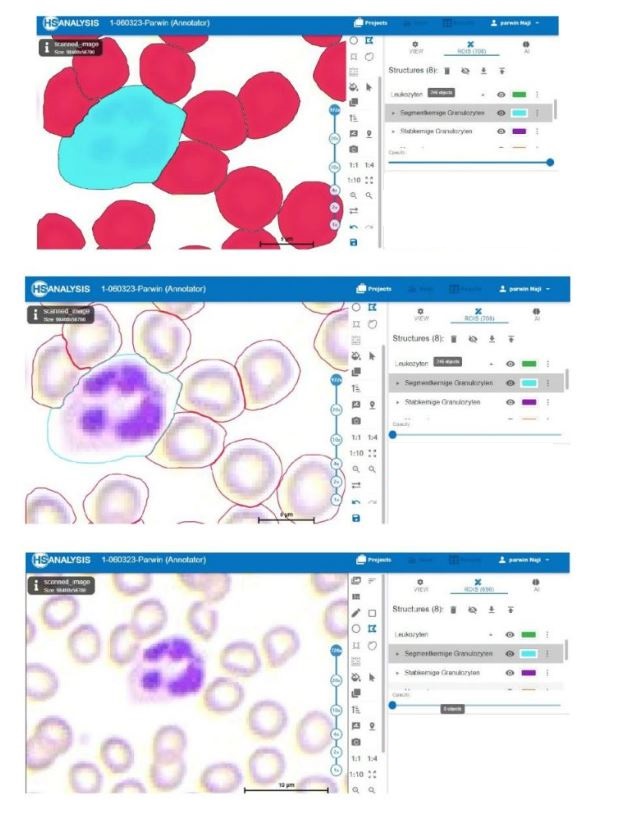
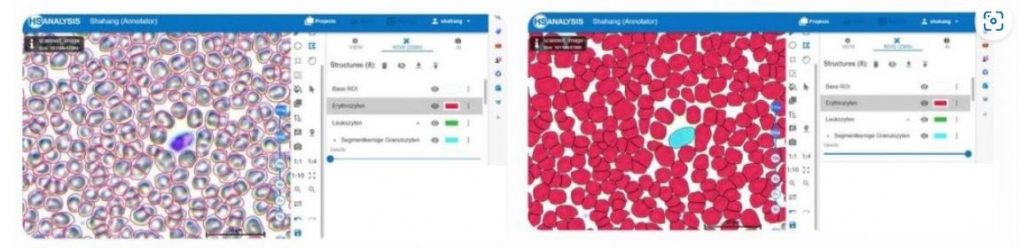
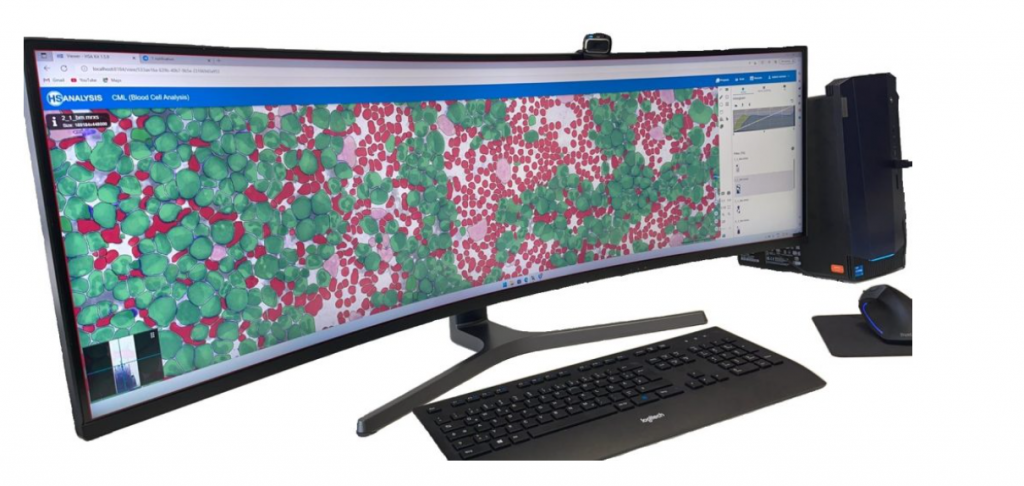
Software shows a section of the entire blood count so that the user can simply show different cell lines to the AI and thereby the AI learns these cell lines automatically.
- Red: Erythrocytes
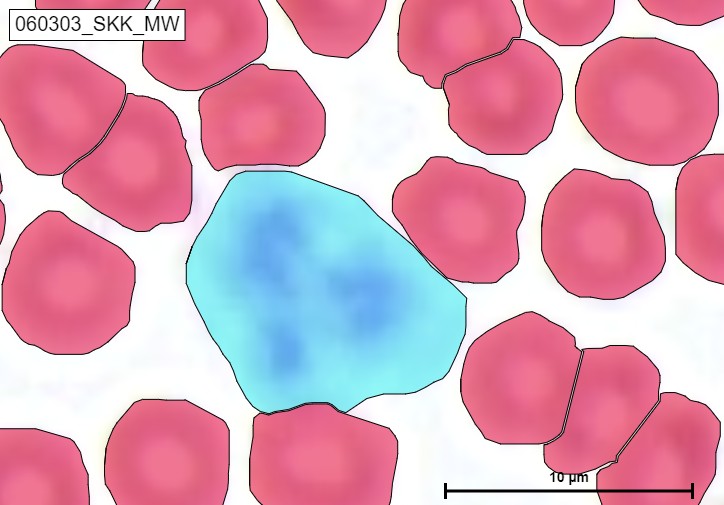
- Light-Blue: Segmented Granulocytes
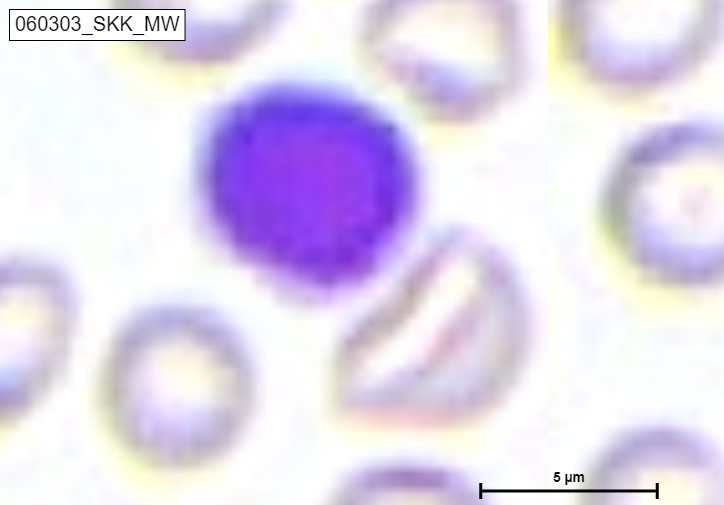
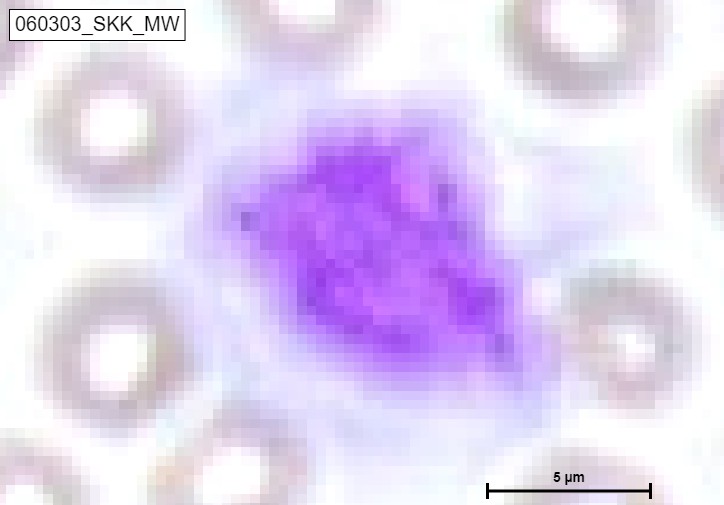
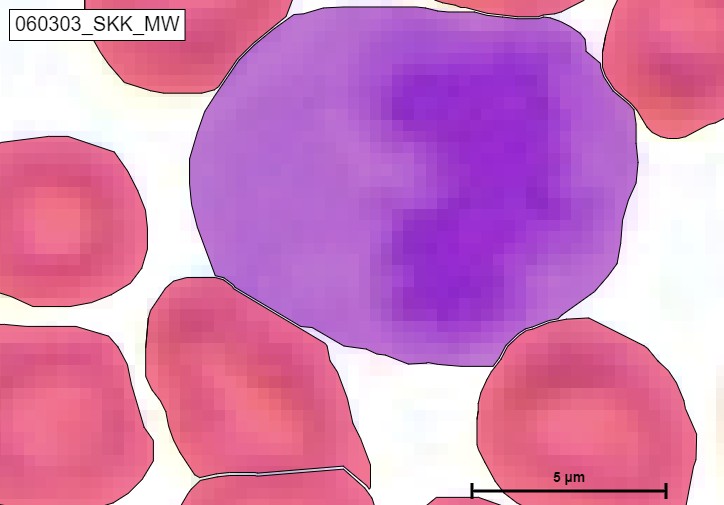
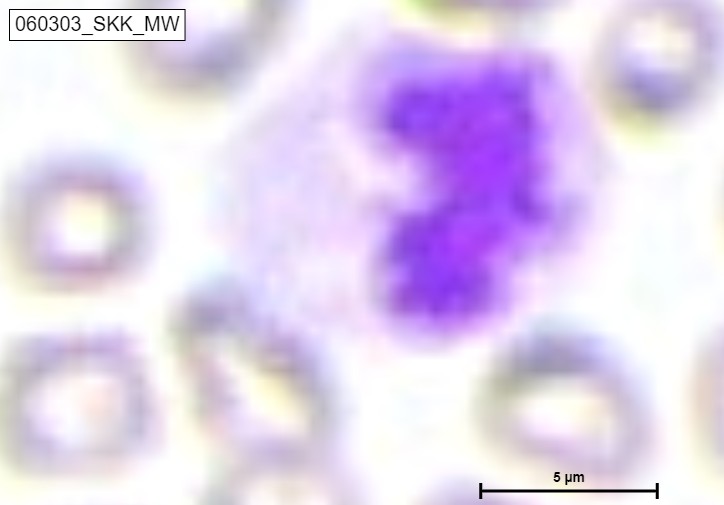
- Purple: Lymphocytes
After the blood smear has been digitized, the ground truth data (GTD) is obtained. These are individual cells that are provided with a label (a class). This data is used to train the HyperHaemaNet Model. Based on evaluation metrics, the HyperHaemaNet Model is assessed at the end and, if necessary, improved.
Overall, the collaboration between HS Analysis and the central laboratory at the Städtisches Klinikum Karlsruhe is of crucial importance for the development of deep learning models for the detection and classification of cells in peripheral blood. The automatic digitization of the blood smears and the acquisition of ground truth data are important steps in developing a high-quality model, like the HyperHaemaNet Model.
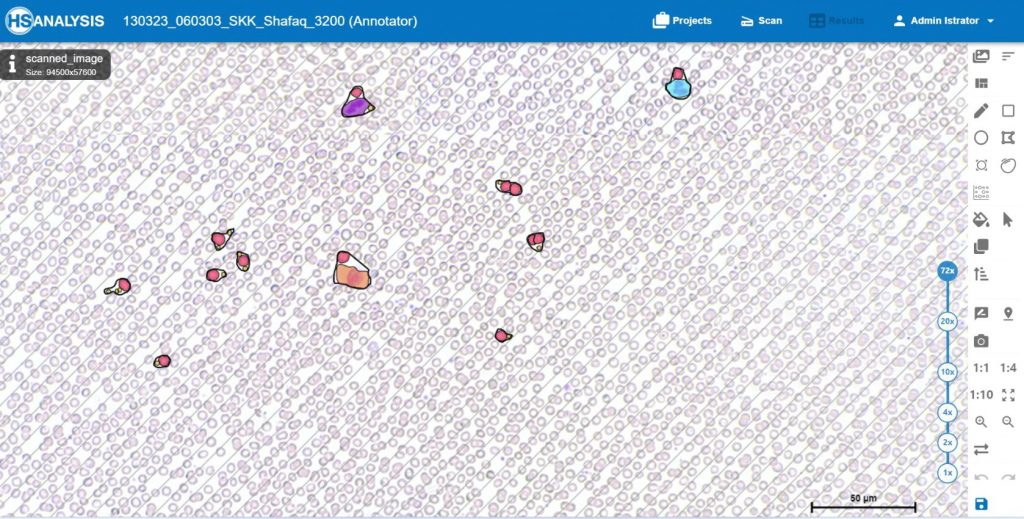
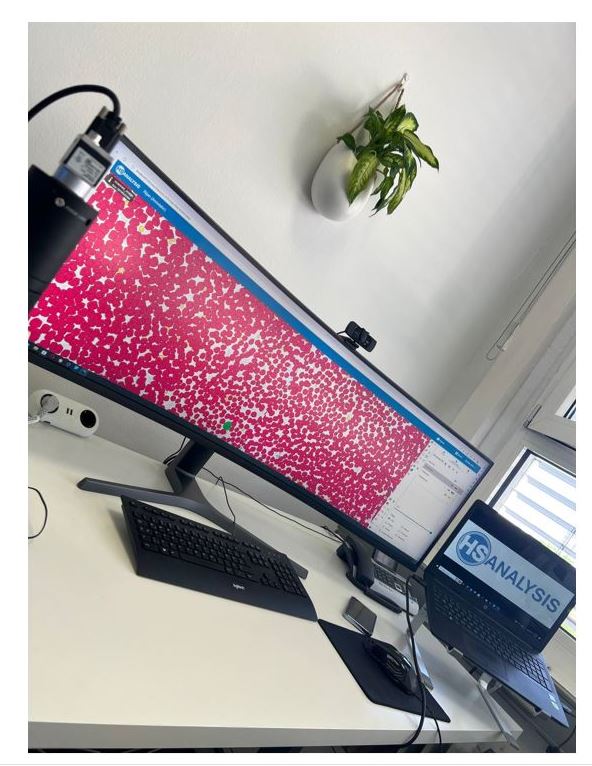
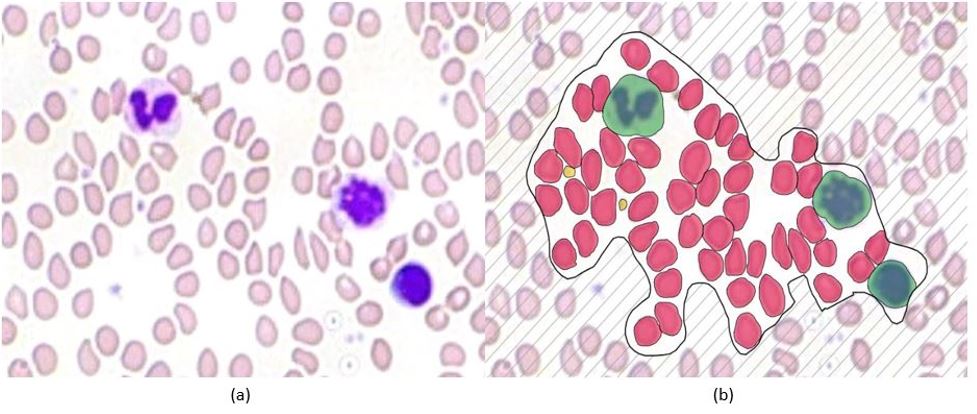
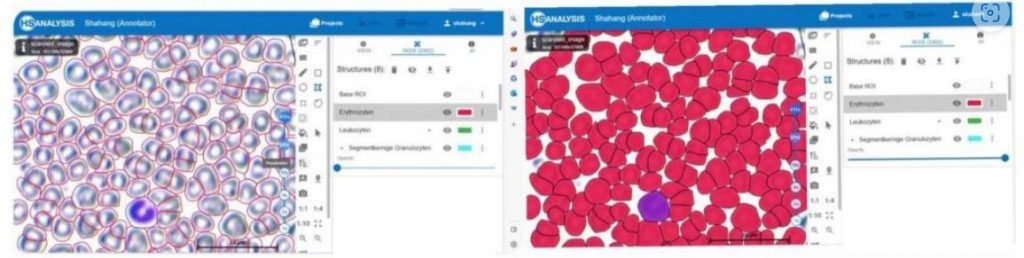
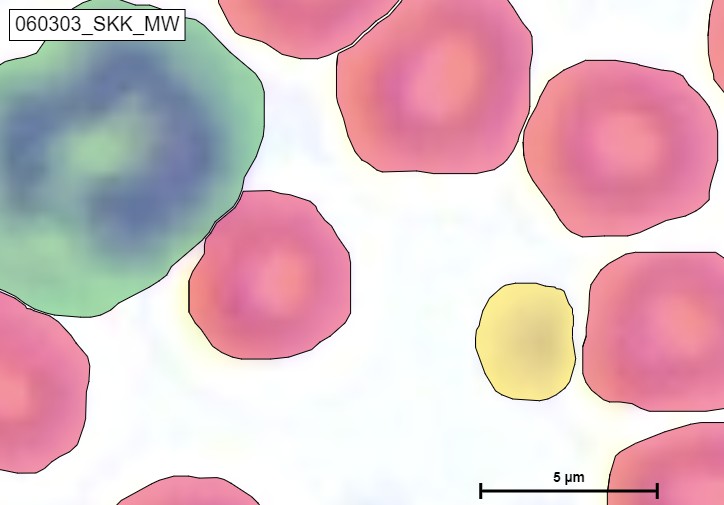
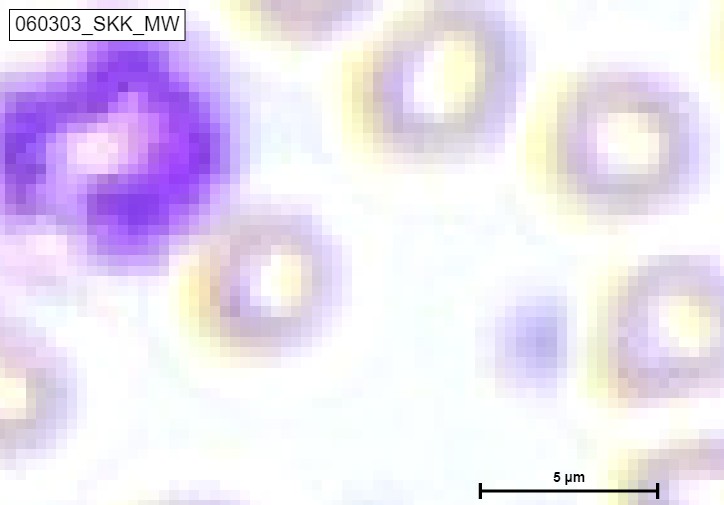
Figure below shows a section of the HyperHaemaNet Model. In (a) you can see the blood cells before using the HyperHaemaNet Model. (b) shows the classification of the cells:
-Red: Erythrocytes
-Yellow: Thrombocytes
-Green: Leukocytes
The following results were achieved with the HyperHaemaNet Model based on the Vision Transformer Framework.
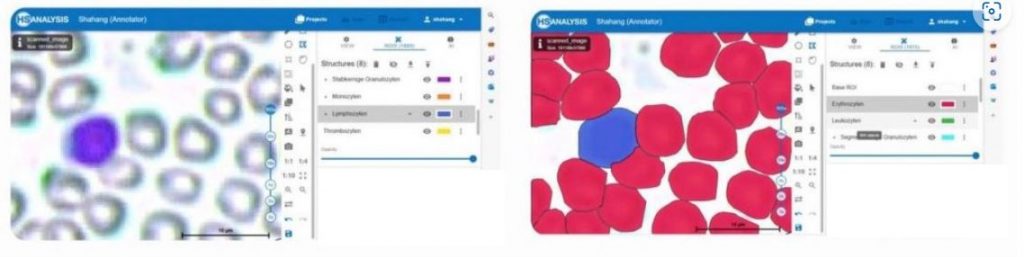
The HyperHaemaNet Model was trained in such a way that a further subdivision of the leukocytes is possible, as can be seen in figures given below. The subclasses of leukocytes can be divided into:
-Cyan: Segmented granulocytes
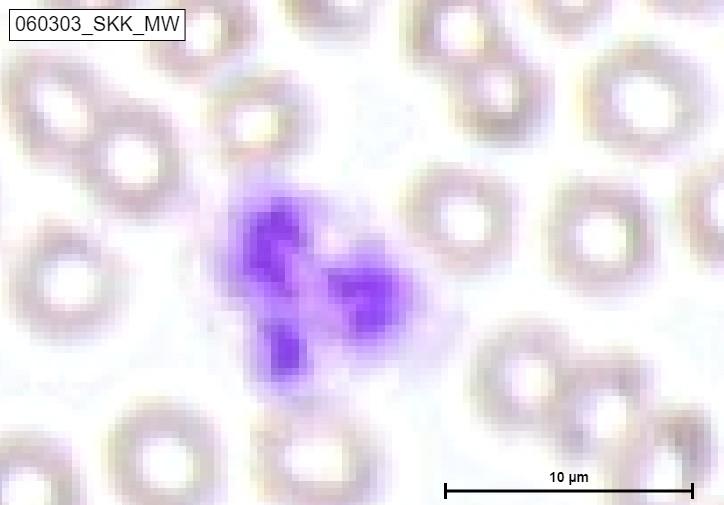
-Puple: Rod-nucleated granulocytes
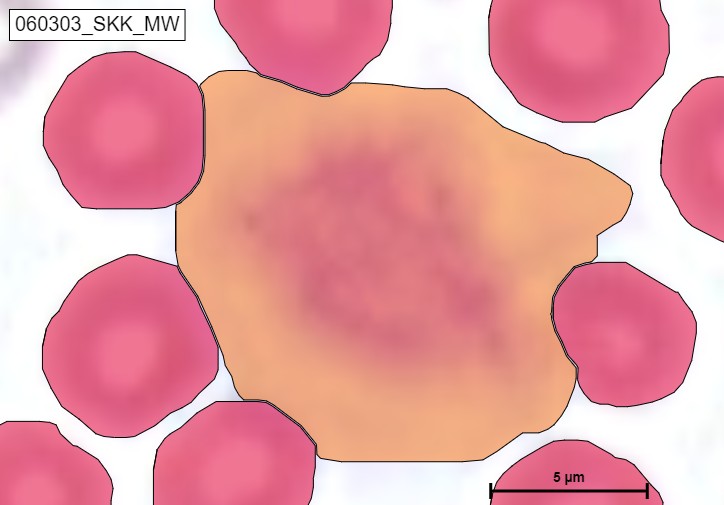
-Orange: Monocytes
-Blue: Lymphocytes
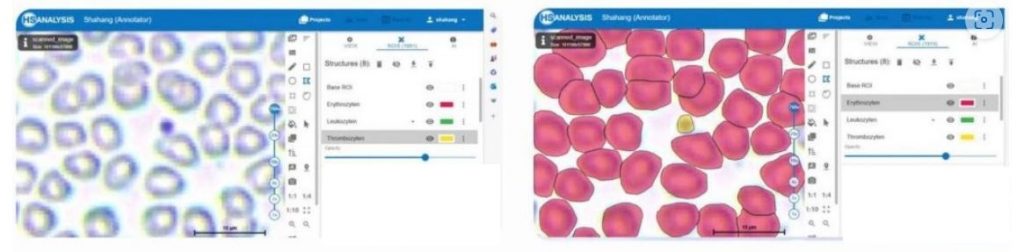
An example of detecting Erythrocytes, Luekocytes and Thrombocytes
With this further subdivision, all blood cells that occur in the peripheral blood of a healthy person can now be recognized and classified.
Most advanced instance segmentation for Haematology worldwide:
The software HSA KIT includes HyperHaemaNet, the most advanced instance segmentation for Haematology worldwide. HyperHaemaNet as deep learning technique was developed at HS Analysis GmbH and based on Vision Transformer (ViT).
In the software HSA KIT data scientists not only create and manage high quality ground truth data or train and manage corresponding deep learning models, they also are able to compare the models with metrics as well as overlays.
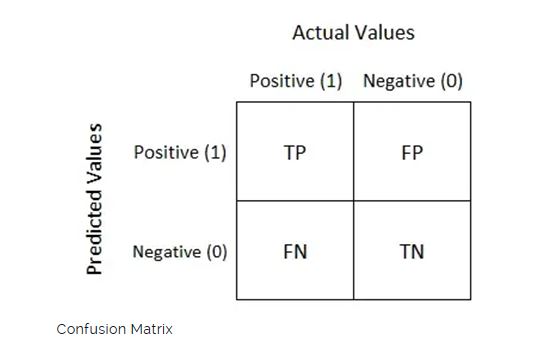
Metric
The effectiveness of algorithms for comprehending medical images is evaluated using a variety of measures. The table used to visualize algorithm performance and determine multiple assessment metrics is called the confusion matrix. Confusion matrices are used to evaluate deep learning models and give a more realistic view of their performance. The output could have two or more classes. In the table, there are four possible combinations of anticipated and actual values.
Mean Average Precision
Mean Average Precision (mAP) is a metric used to evaluate object detection models. Confusion Matrix, Intersection over Union (IoU), Recall, Precision are the sub-metrics that form the backbone of the formula for the mAP accuracy. The mAP is calculated by finding Average Precision(AP) for each class and then average over a number of classes.
Ground Truth Data used for HyperHaemaNet:
| Classes | Erythrocytes | Segmentkernige Granulocytes | Stabkernige Granulocytes | Monocytes | Lymphocytes | Thrombocytes |
| Used Data | 4579 | 2420 | 476 | 296 | 815 | 2193 |
Validation of HyperHaemaNet
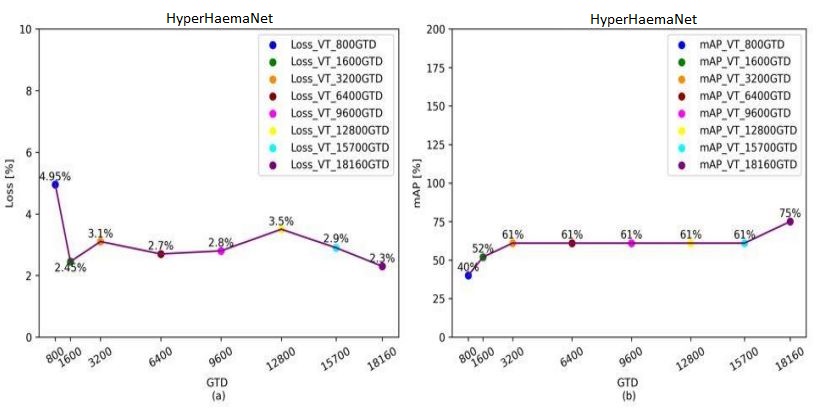
In the case of Loss, which is a function that requires to be decreased in order to have an ideal deep learning model. The loss value would produce a huge number if its predictions diverge too much from the actual results. The graph shows that the HyperHaemaNet which is based on ViT are 2,3 % after 18160 used GTD.
In the case of mAP, the accuracy of the instance segmentation detection is measured using mean average precision (mAP), another performance evaluation metric. Thus, the outcomes of instance segmentation will be more accurate the higher the mAP value. The graph also shows that the HyperHaemaNet based on ViT has superior mAP values being at 75 %.
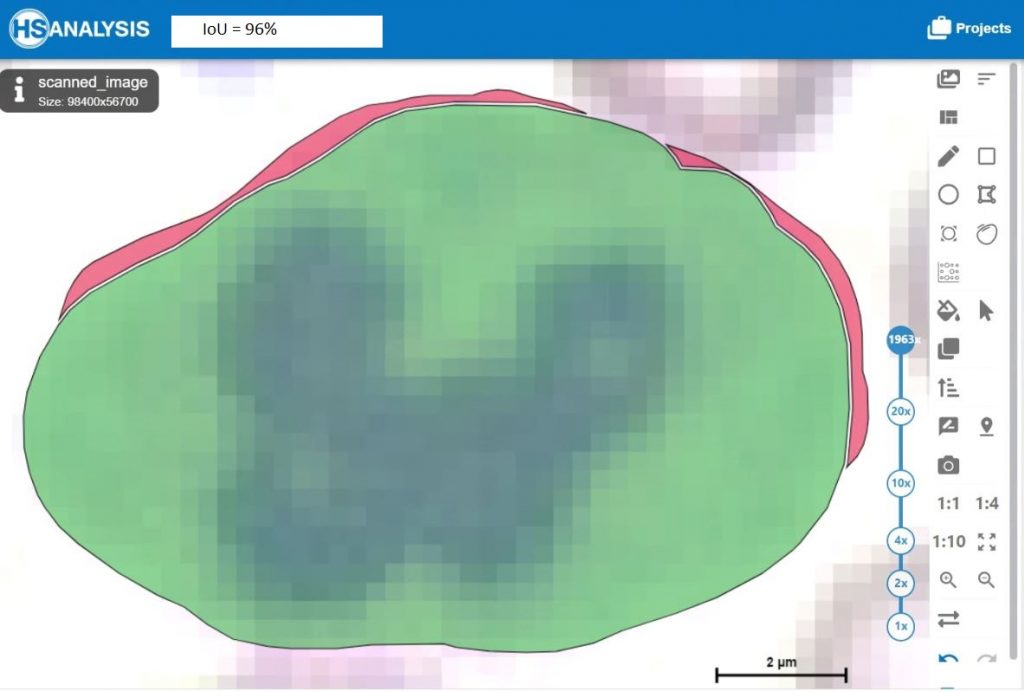
Furthermore the HyperHaemaNet Model shows particularly good results for the outline of the cells (IoU = Intersection over Union).
Possibility to analyze further disease patterns with the HSA KIT
Nowadays, immunohematological markers are used to distinguish between blood leukemias.
There are various immunohematological markers used for the classification of leukemias. Here are some of the key markers:
- CD34: CD34 is a surface marker found on stem cells in the bone marrow and peripheral blood. High CD34 expression may indicate acute leukemia.
- CD13 and CD33: These markers are used in the diagnosis and classification of myeloid leukemias. CD13 and CD33 are myeloid antigens and are often analyzed in combination with other markers such as CD14, CD15, and CD64.
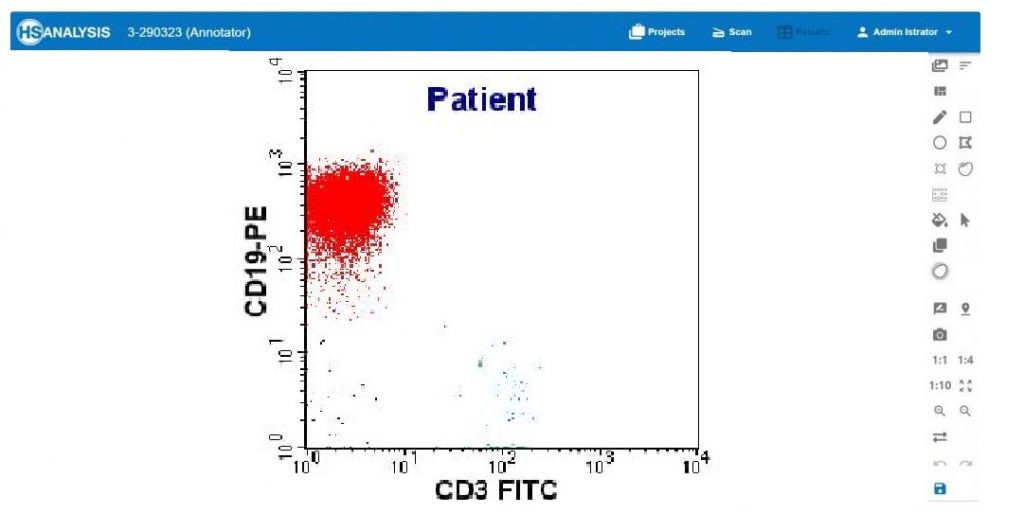
- CD19 and CD20: These markers are used in the classification of lymphocytic leukemias, especially B-cell leukemias. CD19 and CD20 are B-cell antigens and can help determine the type of leukemia.
- CD3, CD4, and CD8: These markers are used to differentiate between T-cell leukemias and B-cell leukemias. CD3 is a T-cell antigen, while CD4 and CD8 represent different subsets of T-cells.
- TdT: Terminal Deoxynucleotidyl Transferase (TdT) is a marker for immature precursor cells used in the diagnosis of acute lymphoblastic leukemias (ALL). High TdT expression indicates a tumor population composed of immature lymphoblasts.
These markers are analyzed in immunophenotyping using flow cytometry or immunohistochemistry to obtain information about the cell marker expression in leukemia cells and support the classification of leukemia. However, it is important to note that the specific selection of markers may vary depending on the individual case and the diagnostic criteria of the treating physician.
The further subdivision of leukocytes into the different disease patterns was not shown here, but it is also possible with the HSA KIT. By analyzing the CD markers with the HSA KIT, further clinical pictures can be classified such as e.g.:
-T-ALL: CD4 + CD8
-pre-B-ALL: CD10 + CD34
-AML: CD117 + myeloid marker
To start the analysis of CD markers in the HSA KIT, you just have to select which CD markers you want to analyze and load them into the HSA KIT by simply clicking on them.
Furthermore, it is possible to detect eosinophilia and basophilia with the HSA KIT. Eosinophilia often occurs in allergic reactions. Basophilia, on the other hand, often occurs in leukemias or parasitic infestations. In order to be able to use these two cell forms for your evaluation, it is possible to add them in the HSA KIT by clicking on the checkboxes.
In another deep learning model (HSA-CML-Paed-Module) the classification of chronic myeloid leukemia (=CML) cells has already started.
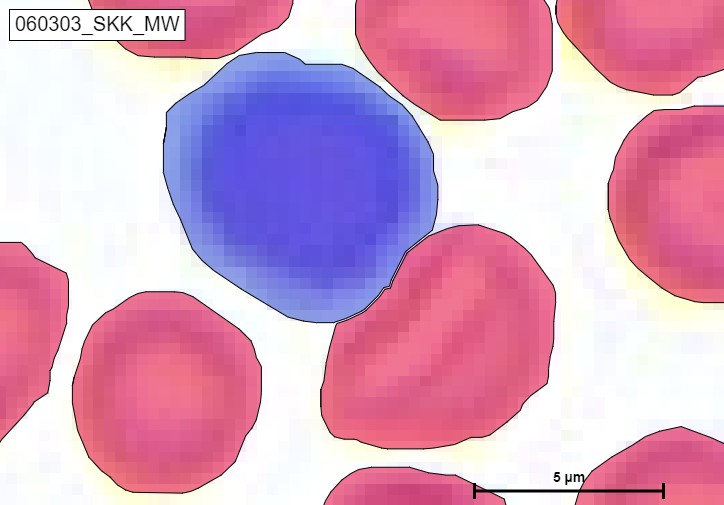
An example of detecting Lymphocyte and Erythrocytes
An exapmle of detecting Segmented granulocytes and Erythrocytes
An exapmle of detecting Monocytes and Erythrocytes
An exapmle of detecting Rod-nucleated granulocytes and Erythrocytes
The HSA-CML-Paed module of the HSA KIT software for multiclinical studies in university clinics and reference centers is based on a neural network in which bone marrow and blood smears are annotated/analyzed and correlated with clinical parameters of the patients. In this context, the knowledge of still unknown pathomechanisms of CML in pediatric patients is obtained. All bone marrow and blood smears of a patient from the time of diagnosis up to the follow-up examination after one year (if the patient is still in remission) are used.
In the future, it will be possible to apply the HyperHaemaNet Model to other disease patterns, such as:
- Benign Hematology – Differential Diagnoses
- AML and MDS (5th WHO classification for morphological diagnosis)
- Hereditary corpuscular anemia
- T-cell lymphomas (diagnostic criteria and strategies, differential diagnosis)
- (Neoplastic) Eosionophilia and combination to NGS
- Effusion cytology
How can HSA KIT contribute to optimize your workflow even further
Before the integration of artificial intelligence (AI) in the medical workflow, doctors faced challenges in analyzing medical images manually and achieving accurate diagnoses. However, with the expertise of HS Analysis (HSA), a healthcare company, and their utilization of AI, specifically Deep Learning, in hospitals, laboratories, and research centers, the process of diagnosing various diseases, including hematology diseases, has significantly improved. The implementation of AI has particularly aided oncologists in identifying diseases more effectively.
Most laboratories use CellaVision for hematology diagnostics. To further improve and perfect the evaluation of CellaVision, the HSA KIT is perfect. By connecting HSA KIT to CellaVision or to your workflow, it is possible to automate the scanning of smears that still have to be manually microscoped by an employee and to evaluate them in real time using a deep learning model (e.g. HyperHaemaNet). This ability to easily integrate HSA KIT into your existing workflow can further save time and improve results even more.
HS Analyses offers the following services:
- Fast automated analysis/scanning of your blood smears: With our state-of-the-art technology, we ensure a rapid and accurate analysis of blood smears. Our automated systems can efficiently examine various parameters such as cell counts, cell morphology, and other relevant characteristics.
- Secure transportation from customers to our specialized laboratories: We prioritize the safety and integrity of your samples during transportation. Our dedicated team ensures that the samples are securely handled and transported to our specialized laboratories, where they undergo meticulous analysis.
- High-quality scan software HSA SCAN: Our proprietary scan software, HSA SCAN, guarantees exceptional quality in digitizing blood smears. This advanced software efficiently captures and processes the scanned images, allowing for precise and detailed analysis by our expert professionals.
At HS Analyses, we are committed to providing efficient and reliable services in the field of blood smear analysis. Our automated analysis, secure transportation, and cutting-edge scan software ensure accurate results and client satisfaction.
HSA offers the HSA KIT, a solution that seamlessly integrates with commonly used microscopes like ZEISS and OLYMPUS in everyday laboratory practices. The HSA KIT ensures a simple, independent, and fast solution for analyzing blood smears. Their highly qualified employees efficiently set up the hardware and simultaneously provide training for the software. The software itself is designed with a user-friendly interface, simplifying the training process and allowing employees to quickly adapt and achieve reliable results.
In the field of hematology, extensive research is being conducted on disease patterns. The HSA SCAN enables the digitization of disease patterns, offering a convenient and rapid means of sharing them with researching physicians. Moreover, these digitized disease patterns can be utilized for educational purposes, aiding in the quick familiarization and training of new employees. The intuitive nature of the HSA KIT software allows for swift analysis of disease patterns, ensuring real-time presentation of results.
Occasionally, it becomes necessary for an oncologist to evaluate blood smears, requiring them to physically travel to the laboratory. This can result in a loss of working time. By digitizing blood smears using the HSA SCAN, these images can be directly accessed by the oncologist at their workplace. This allows them to prepare findings without wasting valuable working time.
Additionally, the HSA KIT software can be seamlessly connected to existing Automation Systems through a common interface. This integration enhances the support provided to laboratory staff during evaluation and enables the rapid transmission of results to attending physicians. By utilizing Deep Learning, the HSA KIT Software can pre-classify and pre-validate unclear results, optimizing the process flow and improving efficiency.
The manual classification performed by laboratory staff can be significantly aided by the pre-classification carried out by the provided HyperHaemaNet Model in the HSA KIT software. This feature enhances the efficiency of daily laboratory routines. Traditionally, blood cell classification involves using classical image processing techniques, such as placing a mask over cells in the background. However, the HSA KIT software leverages a HyperHaemaNet Model specifically developed for blood cell classification, which continues to learn with each classified blood cell. This continual learning improves the performance and accuracy of the classification results over time.
The implementation of AI in the healthcare sector has revolutionized the field of hematology. With the HSA KIT, oncologist can now rely on advanced technology to assist in the analysis of blood smears. This not only reduces the time spent on manual examination but also enhances the accuracy of diagnoses. The HyperHaemaNet Model embedded in the HSA KIT software continuously learns from a vast database of annotated images, improving its ability to detect subtle abnormalities and provide precise diagnostic insights. This synergy between human expertise and AI-powered analysis ensures a comprehensive and reliable approach to hematology diagnostics.
The HSA KIT software offers a comprehensive range of features to support the entire diagnostic workflow. Beyond blood cell classification, it enables the identification and enumeration of specific cell types, such as red blood cells, white blood cells, and platelets. Additionally, the software provides morphological analysis, measuring various parameters such as cell size, shape, and nuclear characteristics. These detailed measurements, combined with the power of AI, facilitate the identification of specific diseases and contribute to personalized treatment plans.
Quality control is of utmost importance in laboratory settings. The HSA KIT software incorporates robust quality control mechanisms to ensure accurate and consistent results. It includes automated checks for sample integrity, staining quality, and cell distribution. By flagging potential issues or inconsistencies, the software empowers laboratory staff to take corrective actions promptly, reducing the risk of misdiagnosis and enhancing overall laboratory efficiency.
The HSA KIT software is designed to seamlessly integrate into existing laboratory information systems (LIS), enabling seamless data exchange and interoperability. This integration streamlines the entire workflow, from sample collection to report generation, minimizing manual data entry and reducing the chances of transcription errors. Real-time data synchronization between the HSA KIT software and the LIS ensures that all relevant information is readily accessible, enabling a smooth and efficient diagnostic process.
Moreover, the HSA KIT software fosters collaboration and knowledge sharing among healthcare professionals. The platform allows for secure remote access, facilitating consultations and second opinions from experts located anywhere in the world. By leveraging telepathology capabilities, pathologists can collaborate in real-time, sharing insights and discussing challenging cases. This collaborative approach not only enhances diagnostic accuracy but also promotes continuous learning and professional development within the medical community.
In conclusion, the integration of AI and Deep Learning in hematology diagnostics through the HSA KIT software has revolutionized the field, enabling faster, more accurate, and comprehensive analysis of blood smears. By leveraging advanced algorithms and seamless integration with laboratory systems, the software empowers healthcare professionals to deliver precise diagnoses, facilitate treatment decisions, and improve patient outcomes. The combination of human expertise and AI-powered analysis has paved the way for a new era of precision medicine in hematology.
How a Deep Learning Model can be integrated into the Laboratory Information System (=LIS)
Laboratory Information Systems (LIS) play a crucial role in managing and organizing vast amounts of data generated in medical and research laboratories. These systems streamline laboratory workflows, facilitate data analysis, and support efficient communication among healthcare professionals. With the rapid advancements in artificial intelligence (AI) and deep learning, there is growing interest in integrating deep learning models into LIS to enhance their capabilities further. In this text, we explore the potential benefits and challenges of integrating deep learning models into LIS and discuss the key considerations involved.
Deep learning models excel at recognizing complex patterns in data. By integrating the HyperHaemaNet Model into LIS, healthcare professionals can leverage their capabilities to improve diagnostic accuracy. Deep learning algorithms can analyze various laboratory data, such as images, test results, and patient records, to identify subtle abnormalities or patterns that might be challenging for human interpretation alone.
Deep learning models can be trained on large datasets to recognize patterns and predict outcomes. By integrating the HyperHaemaNet Model into LIS, healthcare professionals can leverage predictive analytics to identify potential health risks, predict disease progression, or estimate patient outcomes. This can enable early intervention and more personalized patient care.
HyperHaemaNet Model integrated into LIS can automate several labor-intensive tasks, such as data entry, result validation, and report generation. This automation can save time and reduce the risk of human errors, allowing healthcare professionals to focus on more critical tasks and providing quicker turnaround times for laboratory results.
Deep learning models can serve as valuable clinical decision support tools when integrated into LIS. They can analyze data from multiple sources, including medical literature, patient records, and test results, to provide evidence-based recommendations to healthcare professionals. This can assist in treatment planning, drug selection, and personalized patient management.
Integrating the HyperHaemaNet Model into Laboratory Information Systems holds great promise for enhancing diagnostic accuracy, predictive analytics, and decision support in healthcare settings. However, it is crucial to address the challenges related to data quality, validation, interpretability, system integration, and ethical considerations. Collaborative efforts between laboratory professionals, AI experts, and regulatory bodies are essential to ensure the successful implementation of deep learning models into LIS, ultimately improving patient care and outcomes.
The software’s user-friendly interface allows for easy navigation and customization of scanning settings to meet specific needs. Additionally, the integration with HSA KIT software allows for advanced image analysis and interpretation, providing valuable insights for research and diagnosis. Overall, HSA SCAN M software offers a comprehensive solution for labs seeking to streamline their slide digitization process while maintaining quality control.
A glimple of how to manually scan slides with HSA SCAN M
To automatically scan the slides, the existing microscope can be upgraded to an automated microscope station (HSA SCAN A) for low-cost, high-quality performance in a short period of time.
HSA only requires the dimensions of the microscope and any specifications to include, and a custom-fit stand and motor for the microscope will be delivered. This solution eliminates the need for manual adjustments and ensures consistent results.
This will help in:
- Scanning accurately and quickly
- Keeping budget in check: Less expensive than automatic scanners
- Saving time: Automates tasks that require manual intervention
- Better workflow and quality results: reduced risk of errors or inconsistencies
- Intuitive, user friendly controls: Anyone with limited experience with microscopes can operate
Related Sites
For more information or ordering : sales@hs-analysis.com