As a result of the proteolytic processing of amyloid precursor protein and subsequent hyperphosphorylation of tau protein, the Alzheimer’s disease causes the medial temporal lobe and neocortical structures, which are the most impacted part of the brain, to accumulate beta amyloid peptide. This is one of the primary causes of a series of events that leads to mitochondrial dysfunction, synaptic dysfunction, and oxidative stress. Acute COVID-19 infection that causes death are more likely to occur in patients with Alzheimer’s disease.

The difference between healthy brain and Alzheimer’s disease brain in physiological structure and neurons.
According to transcriptional profiles and histological evidence suggesting proteins in vagal nerve and damage to vagal nuclei, as well as clinical data showing vagal system impairment, COVID-19 disturbs the vagal system.

The procedure for transcriptional profiling is depicted in the figure above. The volcanic map illustrates genes that are elevated (red) and downregulated (blue) (blue). A heatmap of the top 20 upregulated genes in the vagal nerve of SARS-CoV-2 patients and controls is also provided.
Morphologies of Beta Amyloid
The commonly accepted standards for an Alzheimer’s disease neurobiological diagnosis include procedures for determining the quantity and location of plaque.
Beta amyloid can take the following morphologies:
- Core
- Punctate
- Vascular
- Diffuse
The identification of progression of the disease and pathophysiology can be based on more accurate measurements of the plaque morphologies and classes, which can also provide direction and insight into the disease mechanisms.
Morphology of HLA Signal
Human leukocyte antigen signals, or HLA signals, are genetic identifiers that are present on the surface of body cells. The ability of the immune system to discriminate between the body’s own cells and foreign things like viruses, bacteria, or donated tissues depends critically on these markers.
HLA signals takes the following Morphologies:
- Microglia process
- Microglia activated
- Microglia resting
- Microglia nodule
- Microglia phagocytic
In order to distinguish it, they are annotated according to the shape of the HLA Signals that are present on the cell surface.
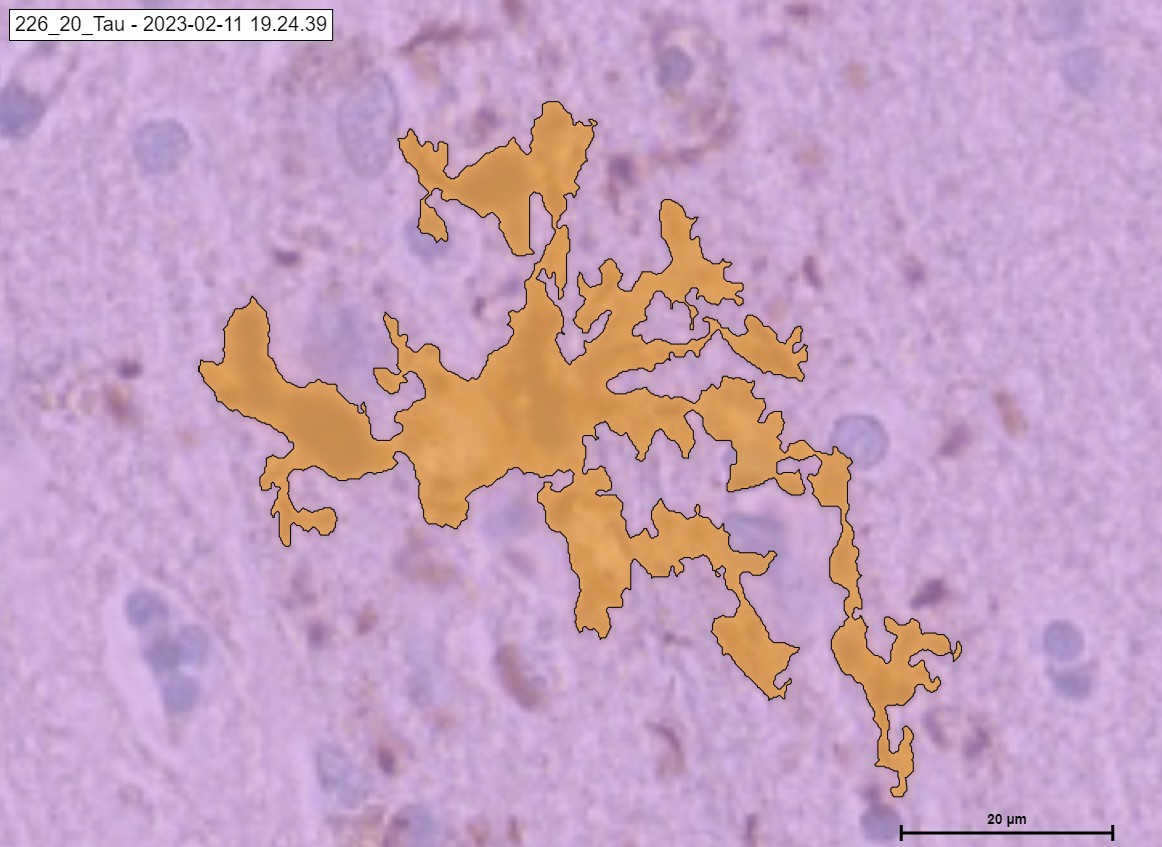
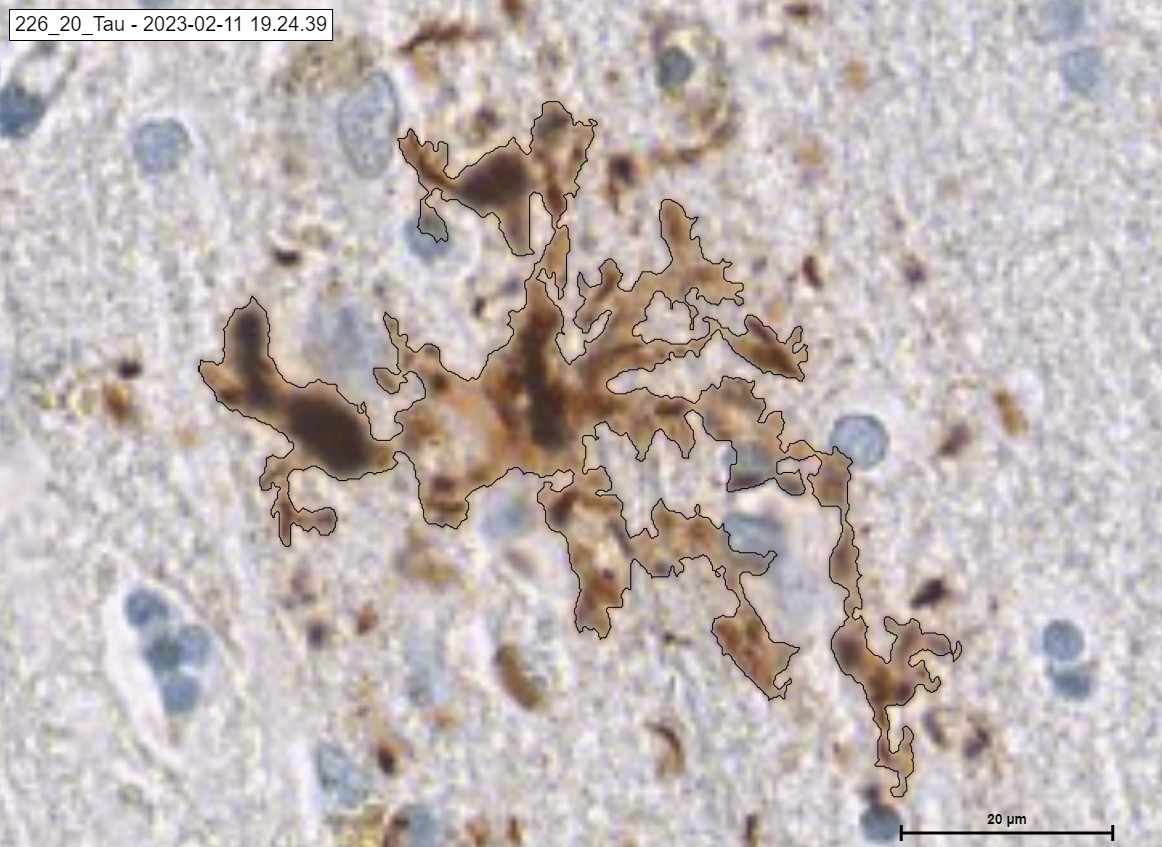
Morphology of TAU protein
Tau is a protein that helps to stabilize the structure of neurons; however, when it accumulates abnormally, it can lead to neurodegenerative diseases like Alzheimer’s. The presence of tau in Covid-19 patients suggests that the virus may have long-term cognitive effects.
TAU protein takes the following Morphologies:
- Tau tangle
- Pre tangle
- Tau neurotic
- Tau thread
Morphology of Cortex, WM and Meninges
The terms „cortex,“ „WM“ (White Matter), and „meninges“ are taken from neuroanatomy to describe the structure of convolutional neural networks (CNNs), which are frequently used for image analysis and computer vision tasks. The arrangement and operation of various components of a neural network architecture are described using the following terms in a metaphorical sense.
Cortex, WM and Meninges takes the following Morphologies:
- Cortex: In deep learning morphology, the term „cortex“ typically refers to the outermost layer of a neural network, which corresponds to the initial layers of the network responsible for feature extraction. Just as the brain’s cortex processes sensory information and extracts meaningful features, the network’s „cortex“ processes input data and extracts relevant features.
- WM (White Matter): In this context, „WM“ stands for „White Matter,“ and it is used to describe the intermediate layers of a neural network. These layers are called „white matter“ because they are often seen as conduits for information flow, similar to how white matter in the brain connects different regions. In a neural network, these layers are responsible for intermediate-level feature representations and connecting different parts of the network.
- Meninges: „Meninges“ is another borrowed term that may be used in deep learning morphology to describe protective layers or constraints applied to the neural network. Just as the meninges protect the brain and spinal cord, in this context, „meninges“ could refer to layers of regularization or constraints applied to the neural network to ensure it generalizes well and avoids overfitting.
These terms are not universally adopted, and their usage can vary among researchers and educators. They are used metaphorically to help convey the idea of different layers or parts within a neural network and their roles in processing data and extracting features, drawing an analogy to the structure and function of the human brain.
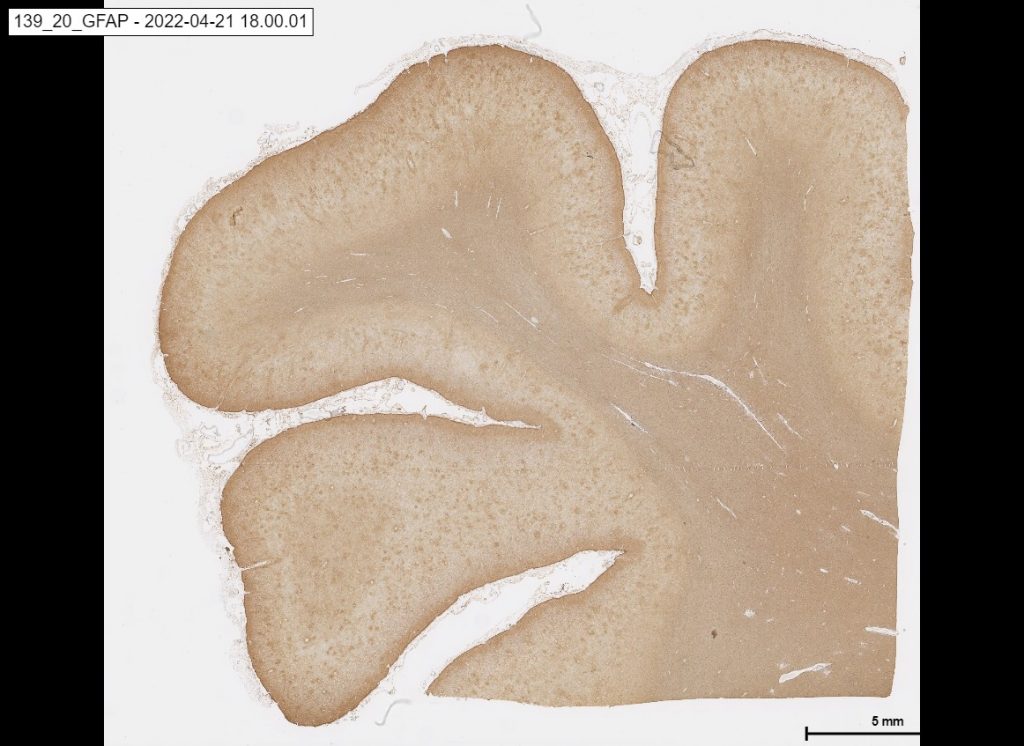
Glial fibrillary acidic protein (GFAP)
The fundamental protein known as GFAP, or glial fibrillary acidic protein, is primarily present in astrocytes, specialized cells in the central nervous system. While GFAP is a vital biomarker in brain research and primarily linked to neurological processes, deep learning rarely uses it. Instead, deep learning models use a variety of data-driven methods and neural networks to solve complex problems.
the below picture is an example of GFAP:
HSA KIT
HSA KIT Software, „Neuro COVID 19“ Module concentrates on next generation sequencing data by supplying a greater comprehension of disorders.
Our „Neuro COVID 19“ Module uses AI to analyze by training to recognize known information using a training data set which is done by the software employs AI. The unlabeled sequences can be automatically recognized by the AI. Then, additional data that are comparable to the data in the training model set are discovered using the matching deep learning. This provides an overview of the clinical importance and severity of associated data variants to predictive analytics feature offers doctors, researchers and laboratory diagnostic aid.
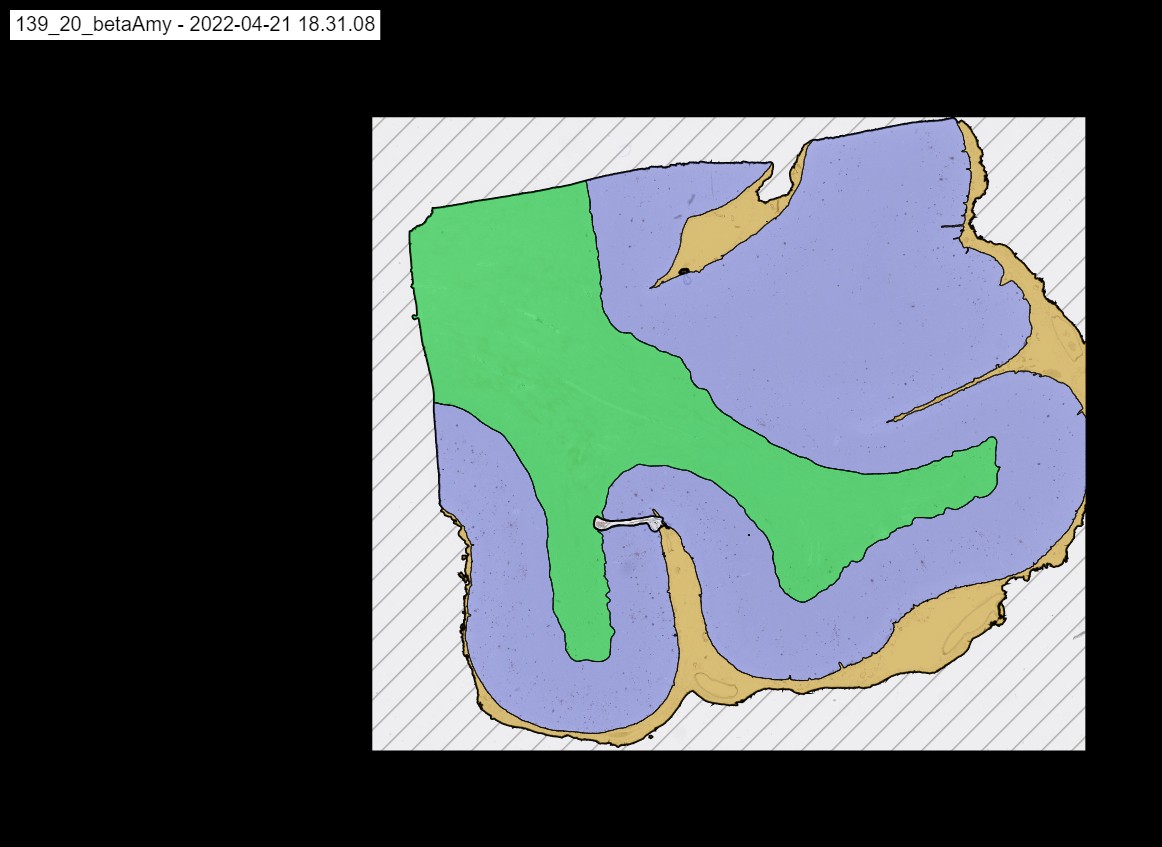
An example of „Neuro COVID 19“ Module detecting white matter, cortex, meninges and Beta Amyloid.

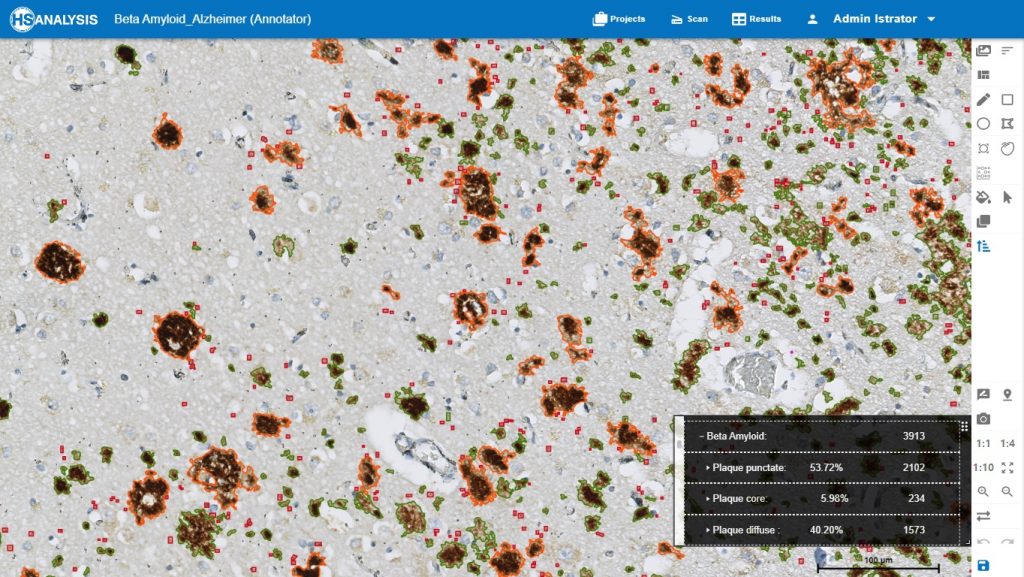
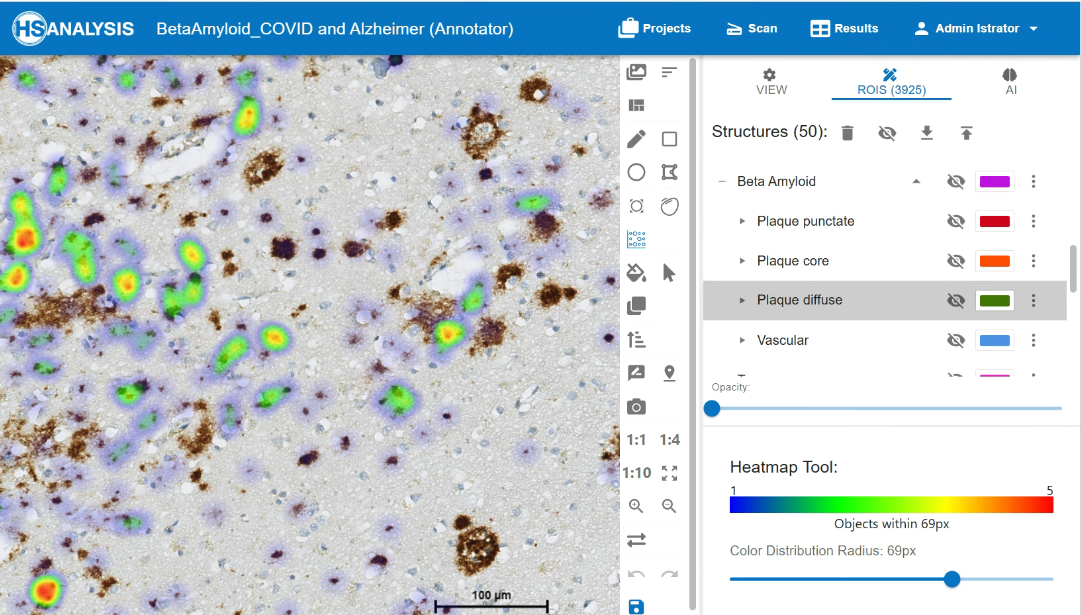
Zoom in view of Beta Amyloid Classes. Plaque core in orange color, plaque punctate in red color and plaque diffuse in green color.
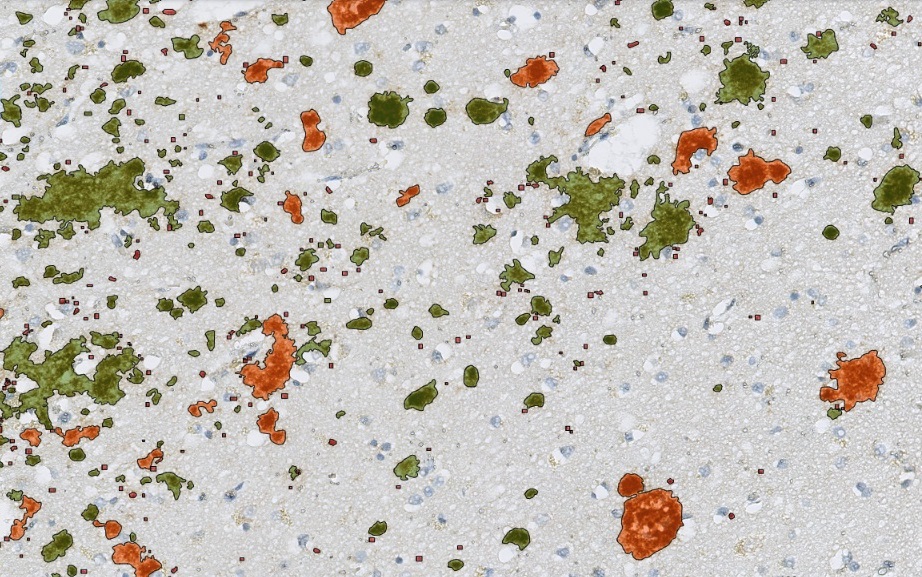
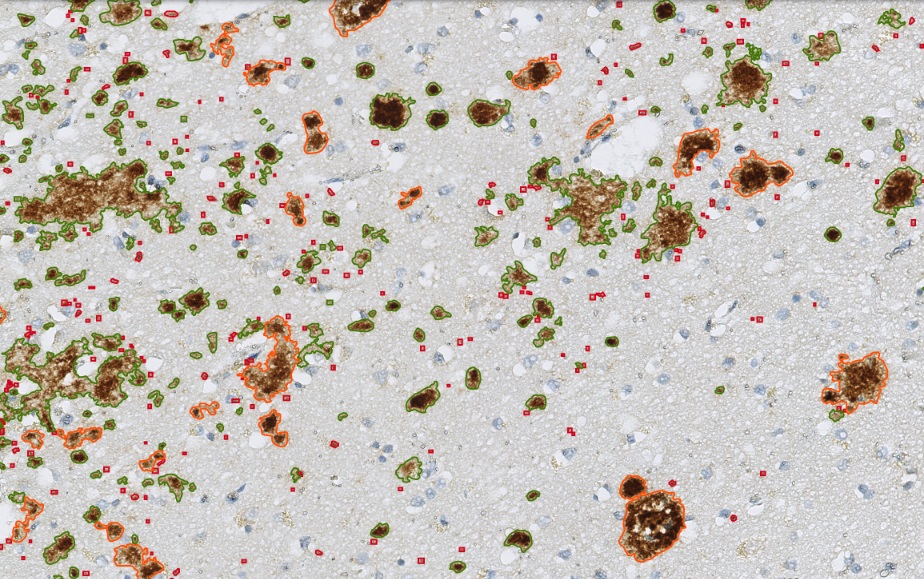
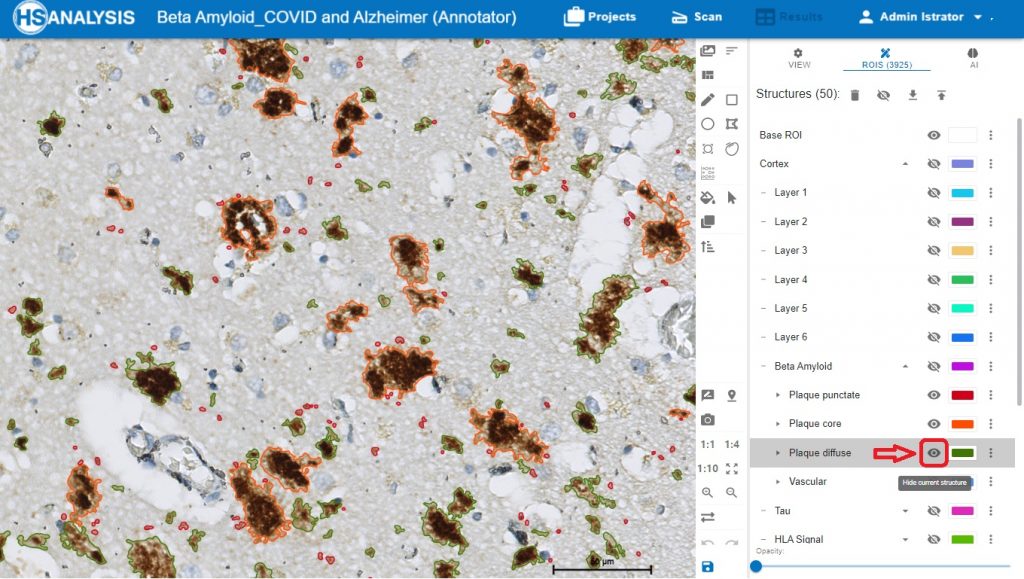
The „Neuro COVID 19“ Module detecting the classes of Beta Amyloid in cortex. Plaque core in orange color, plaque punctate in red color and plaque diffuse in green color.
The „eye“ symbol used for showing and hiding the structures, to disable classes to be shown, and to able the wanted class to be shown.
An example HLA signals. .
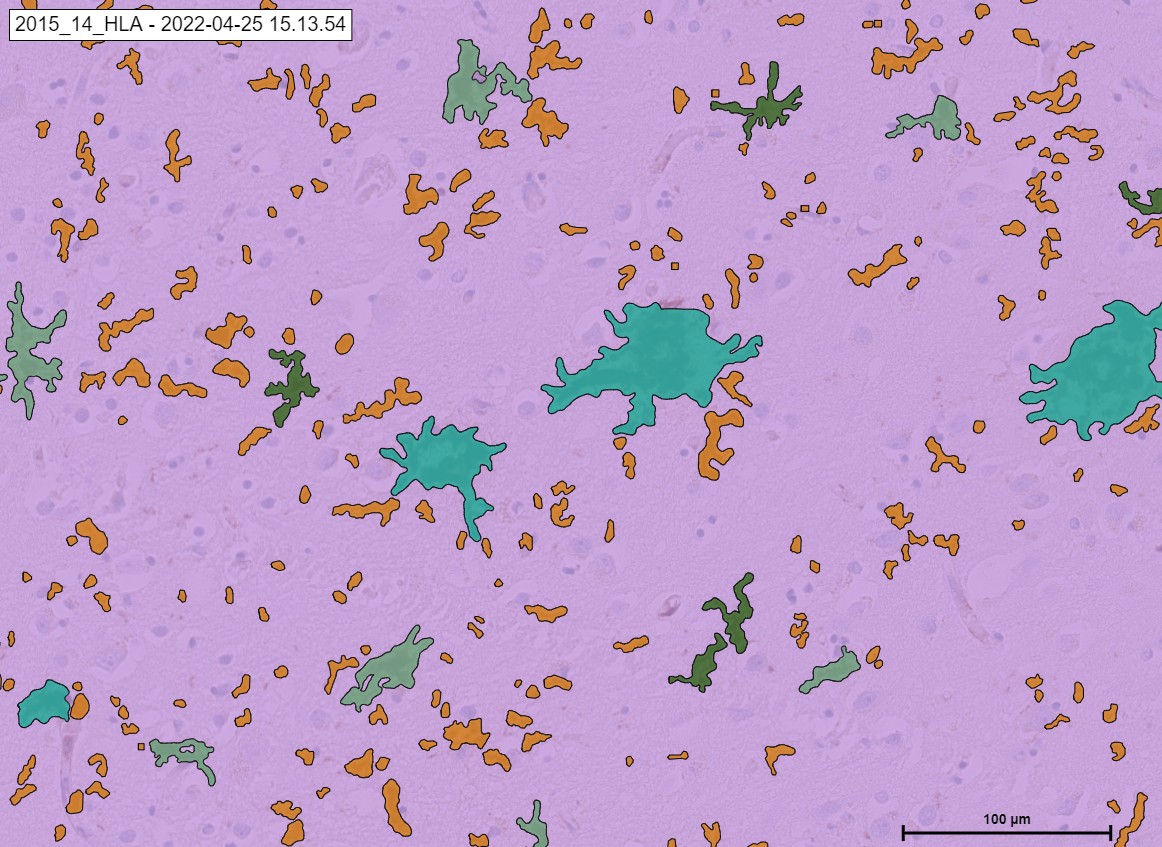
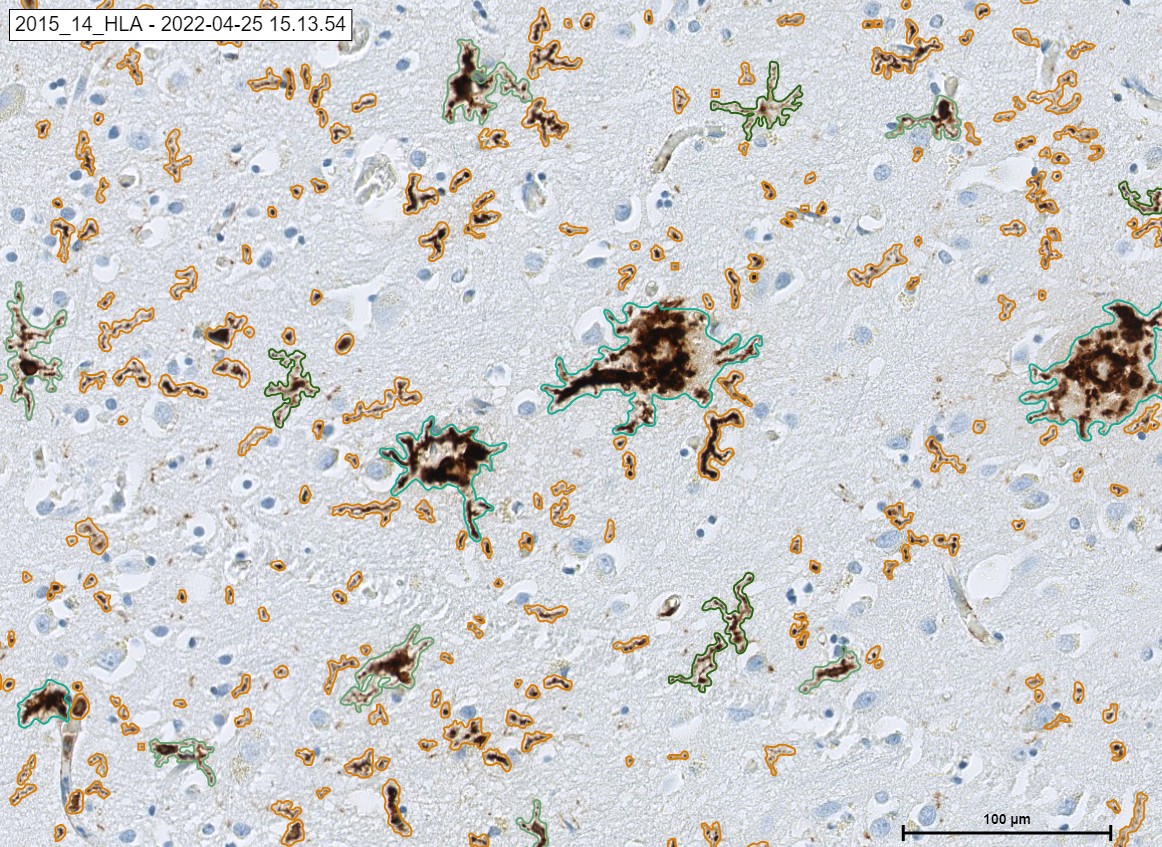
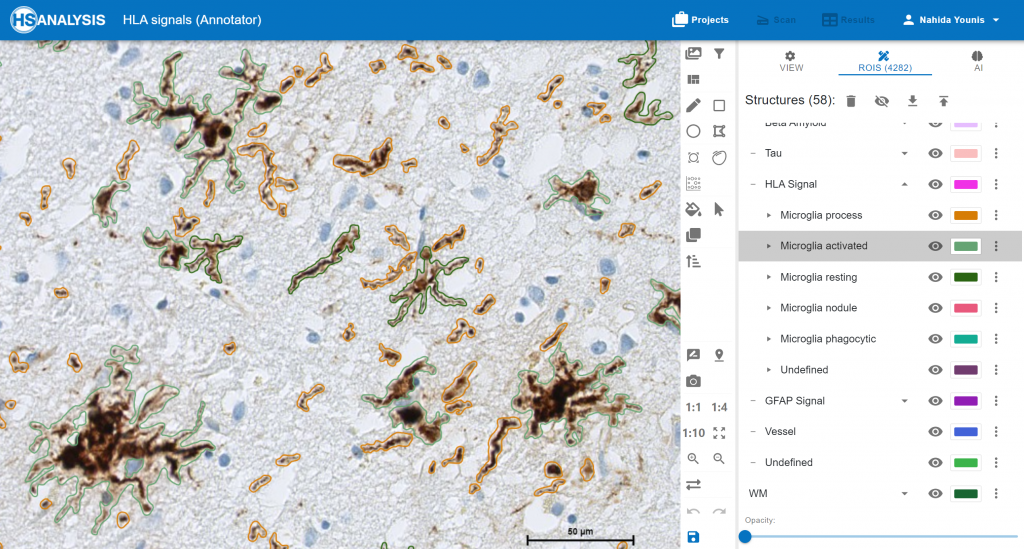
The „Neuro COVID 19“ Module detecting the classes of HLA in cortex. Microglia activated in green color, microglia process in orange color and Microglia phagocytic in light green color.
An example of Neuritic.
An example of Undefined, PreTangle and TAU Tangle.
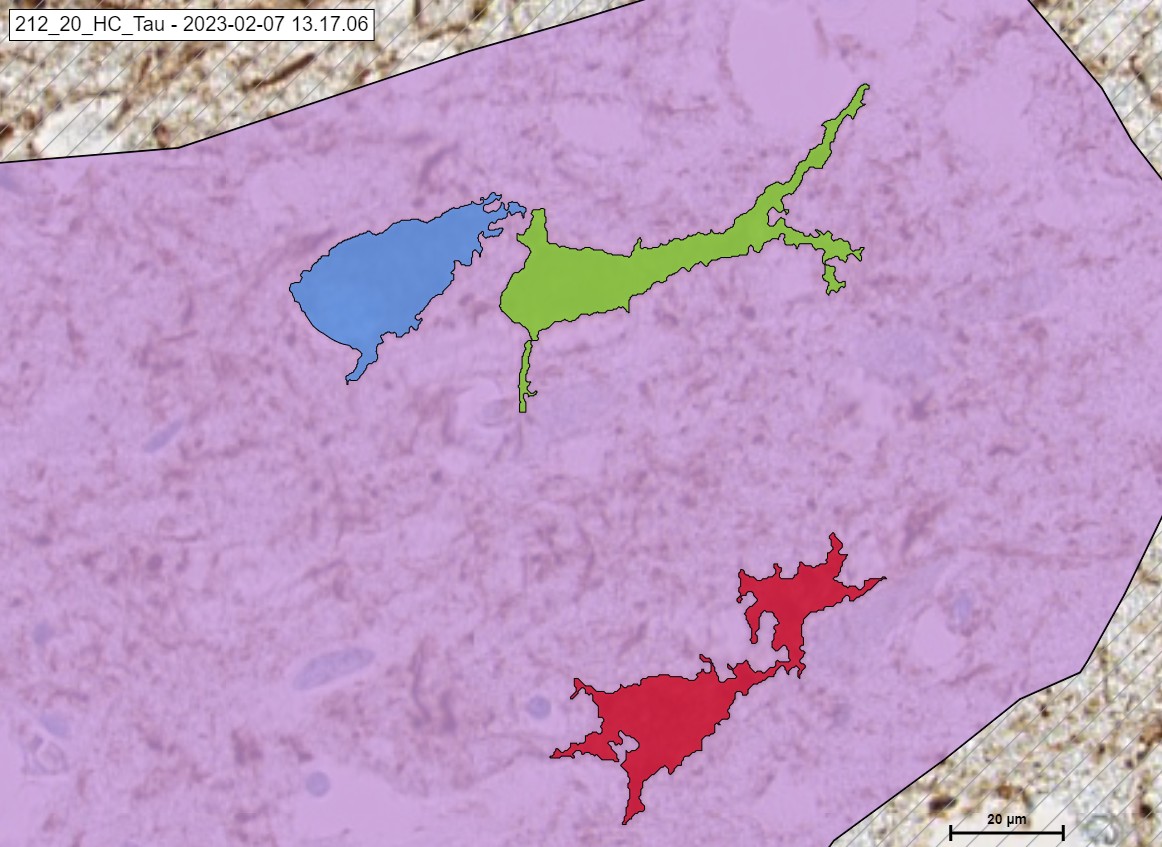
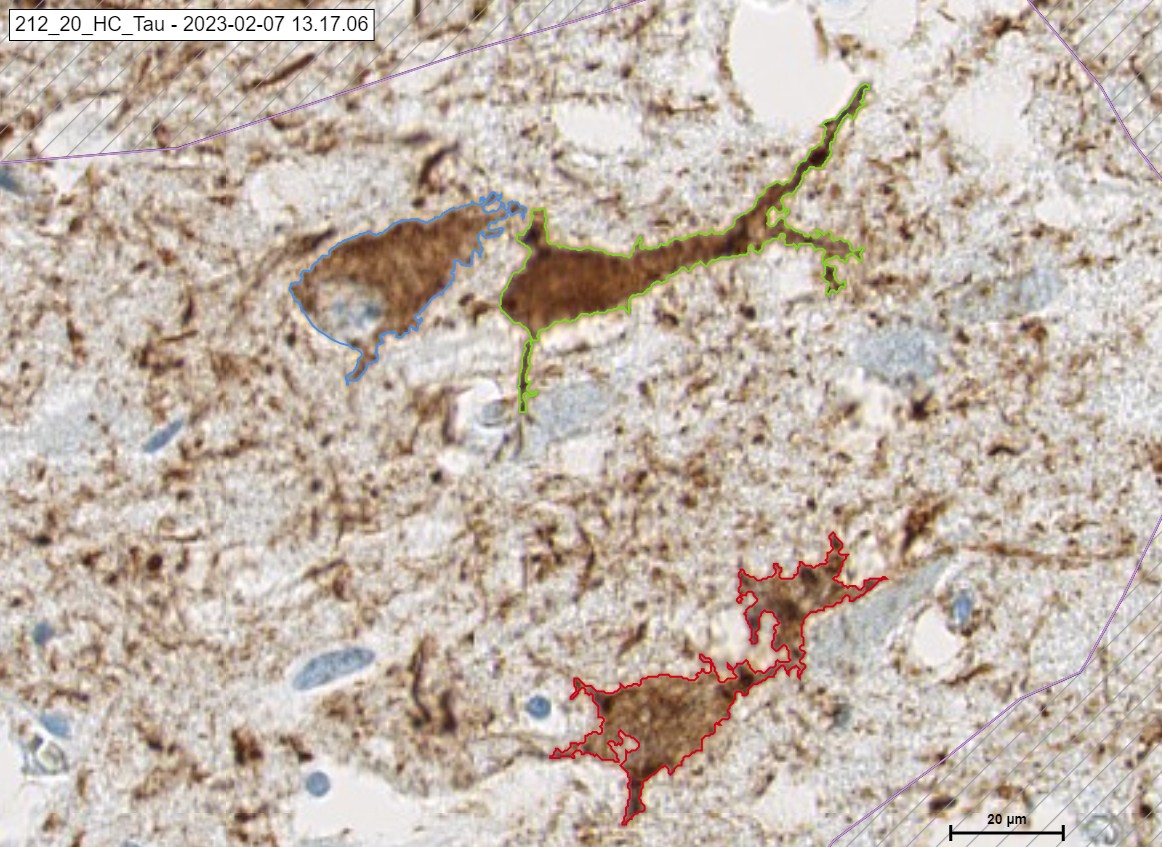
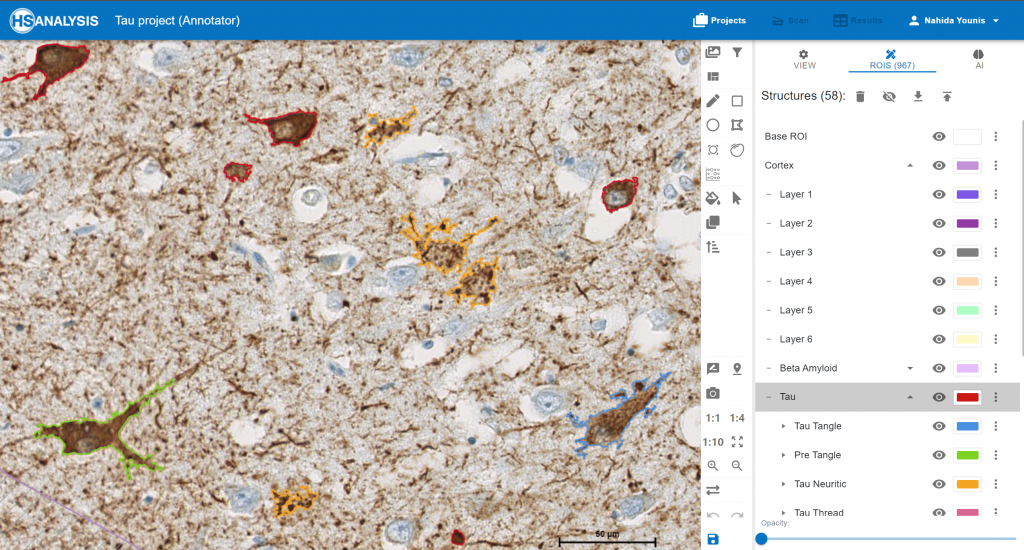
The „TAU“ Module detecting the classes of Tau in cortex. Pre Tangle in green color, Tau Tangle in orange blue, Tau Neuritic in orange color and Undefined in red color.
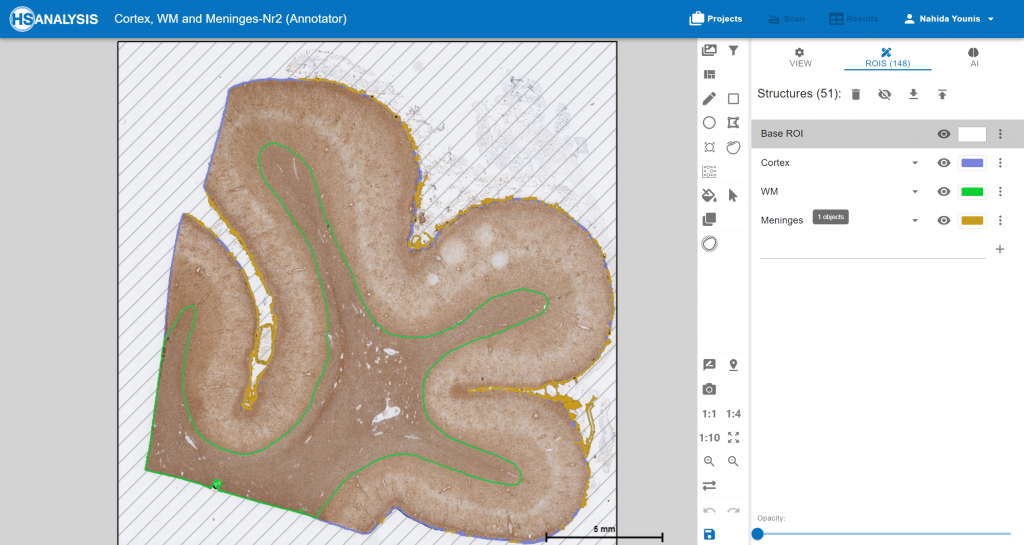
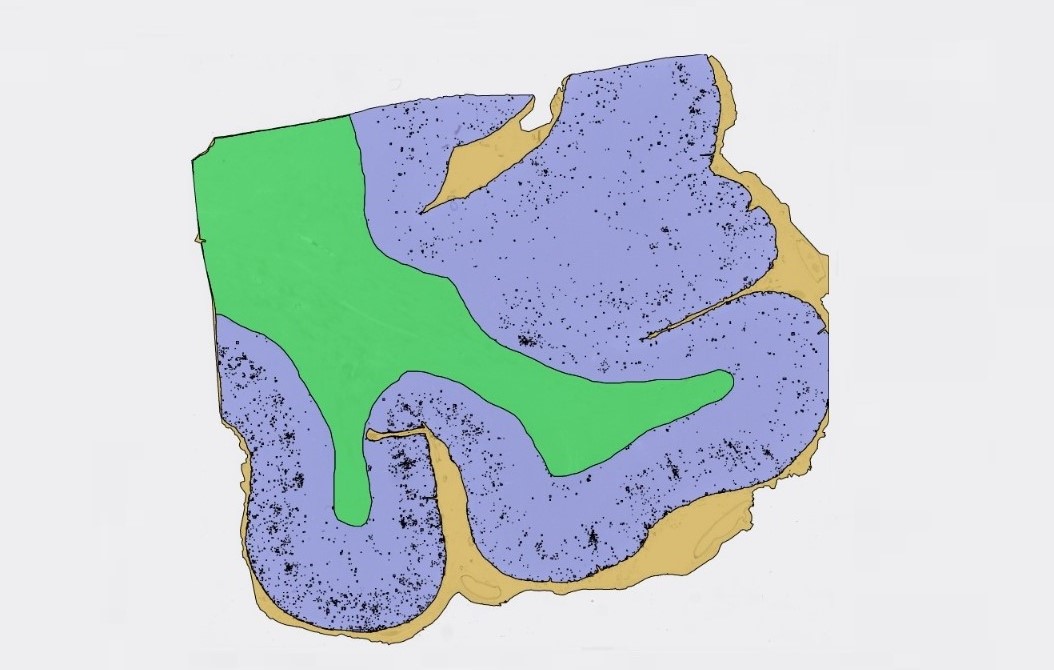
The Module of convolutional neural networks (CNNs) detecting cortex, WM and Meninges. cortex in purple color, WM in green color and Meninges in brown color.
An example of cortex,WM and meninges.
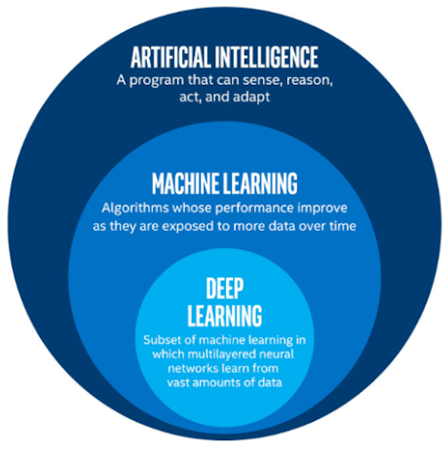
Deep Learning (DL)
The relationship between AI, machine learning, and deep learning. AI is a term used to describe approaches that allow computers to imitate human behavior. Machine learning uses algorithms that have been trained on data to enable computers to make predictions or classifications. Deep learning is a form of machine learning that uses multi-layered neural networks to analyze data and recognize patterns, similar to how the human brain works. The neural network’s design is based on the structure of the human brain.
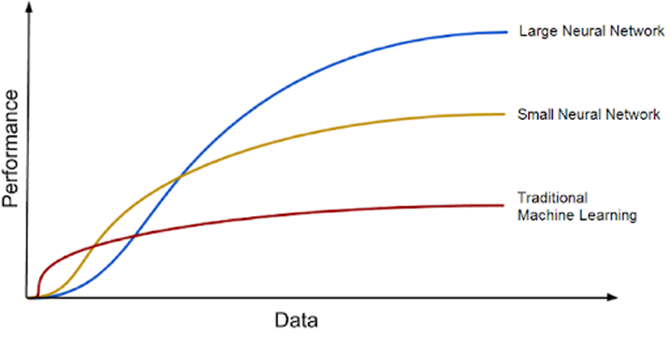
Ground Truth Data (GTD)
GTD refers to the true nature of the problem being addressed by a machine learning model and is necessary for the model to learn from labeled data. The more annotated data there is, the better algorithms will perform. In supervised learning algorithms, human evaluators or annotators must often develop ground truth labels, which can be expensive and time consuming. The text also compares GTD to the fuel needed for a ship engine, with DL models being the engine and the large amounts of data being the fuel. DL models tend to improve with increasing amounts of training data, and the era of big data presents enormous opportunity for new DL advances.
Cost and Loss Function
The goal in developing a DL model is to minimize the error between the predictions and the true values. This is done using loss functions which are associated with each training example. The cost function is the average of the loss function values over all data samples. The cost function is optimized to reduce the error in DL. By optimizing the cost function, we can achieve the best results in DL.
Metrics
The matrices, which are important tools for evaluating the performance of machine learning models. Confusion matrices are produced when there are classification errors, and they contain four different values: True Positive, False Negative, False Positive, and True Negative. Classification metrics such as Sensitivity, Specificity, Accuracy, Negative Predictive Value, and Precision can be calculated based on the confusion matrix.
Mean Average Precision (mAP)
The Mean Average Precision (mAP) formula is based on several sub-metrics, including the confusion matrix, Intersection over Union (IoU), recall, and precision. It calculates the weighted mean of precisions at each threshold, taking into account the increase in recall from the previous threshold. The mAP is calculated by determining the AP for each class and then averaging the results over many classes. It measures the trade-off between accuracy and recall and is a useful measure for most detection applications.
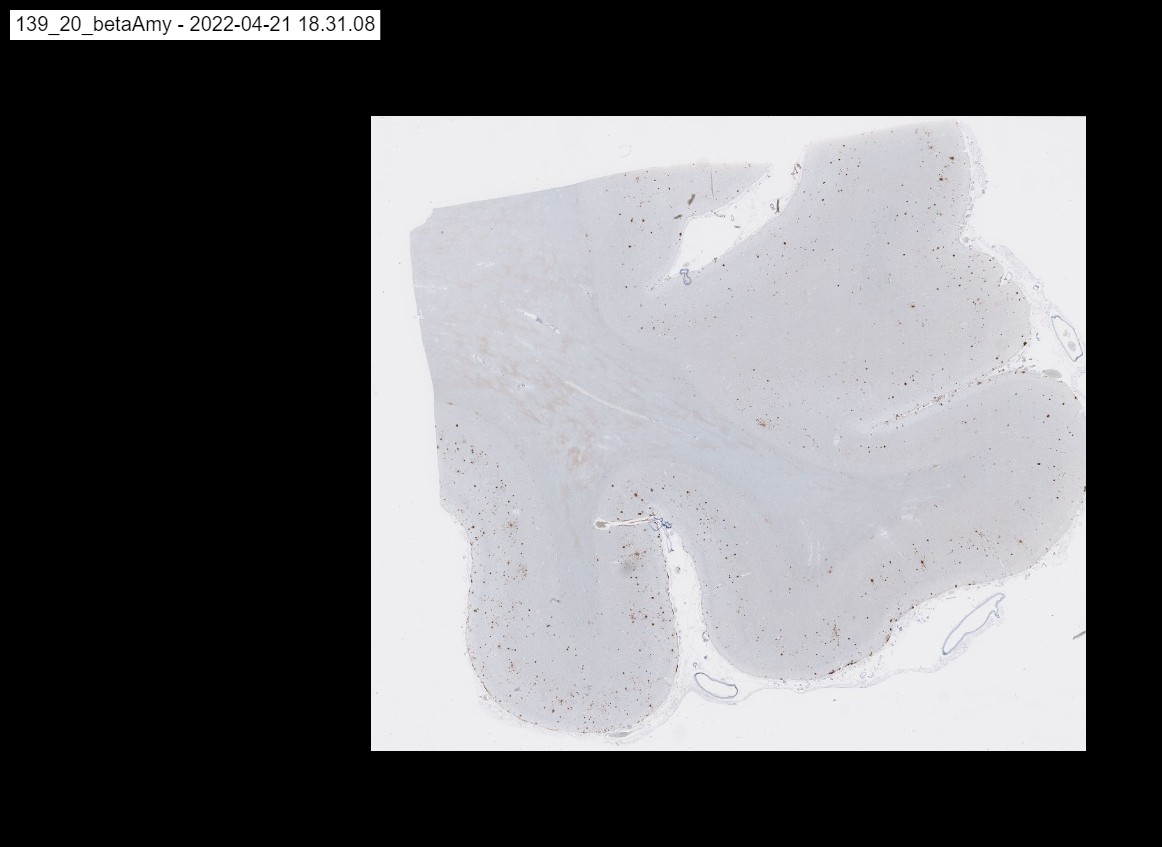
Creation of GTD
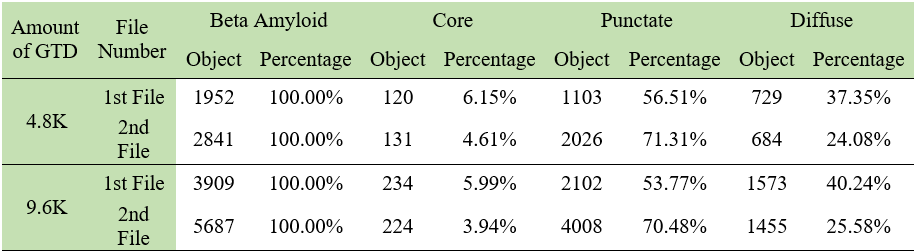
The samples used for the DL model were obtained from the brains of deceased individuals by slicing and staining the cells with different methods. These slides were then converted to digital NDPI files and sent to us to create a DL model. To create the GTD needed for the DL model, the NDPI files were loaded into HSA KIT software and the target area (Beta Amyloid) annotated and classified into core, punctate, and diffuse categories. The model trained with 4793 GTD but not good enough, so more GTD were created and the model trained again with 9596 GTD. The class distribution and percentages in the created data are given in the table below.
Selection of The Data Set
After creation of GTD, the below settings were used for 2 different architecture to train a model.
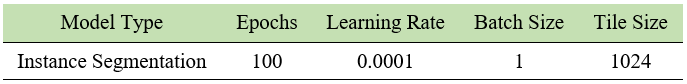
HyperAmyNet
The HSA KIT utilized to detect beta amyloid signals in brain sections as WSI. The software includes a DL model called HyperAmyNet that focuses on segmenting and classifying beta amyloid signals. Two types of HyperAmyNet were implemented in HSA KIT: Type 1, which is based on the Mask R-CNN architecture, and Type 2, which is based on the ViT architecture.
Interpretation of Trained Model Results
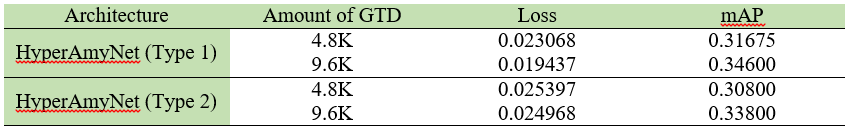
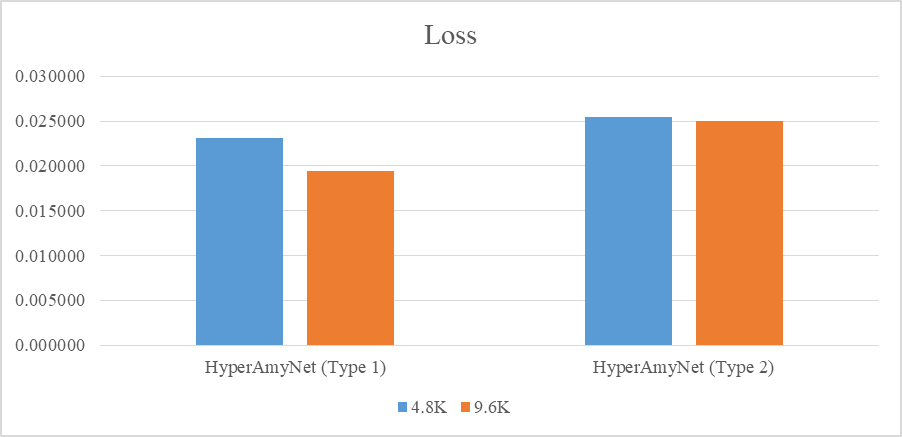
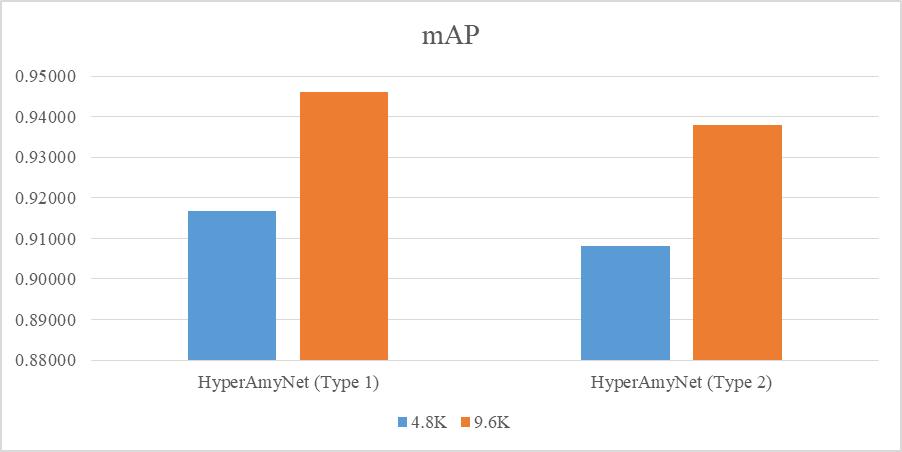
The settings presented in table below were selected to train the models. Loss and mAP were used to compare between models, where a lower loss and higher mAP are desirable characteristics for a better model. The loss and mAP of both HyperAmyNet (Type 1) and HyperAmyNet (Type 2) models were compared with measured loss for both the 4.8K and 9.6K GTD models. The results showed that both models had higher loss when trained with 4.8K GTD and lower loss when trained with 9.6K GTD, as shown in table and bar graph below. Similarly, both models had higher mAP when trained with 9.6K GTD and lower mAP when trained with 4.8K GTD, as shown in table and bar graph below. These results demonstrate that the amount of GTD is an important factor in developing a good model, as discussed previously.
Visual Interpretation of The Results
At the beginning, always the output has to be checked visually. Because there will be always numbers, and numbers could be reasonable by coincidence, but actually could be wrong. Checking visually from beginning then comparing it to the numbers is the best way to trust the AI and having the best model. After creating trusted AI model, it can be used confidently, fully automated and under the control of AI.
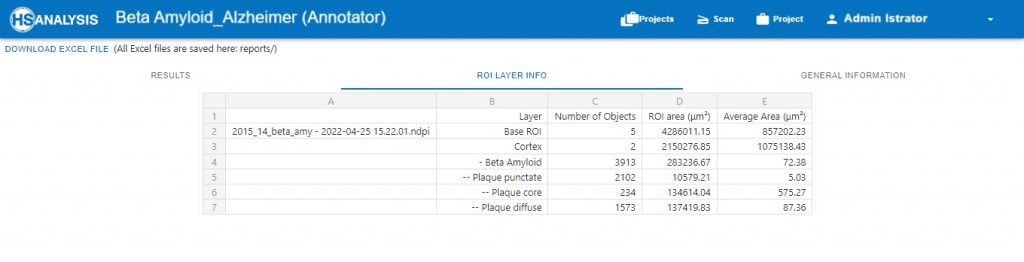
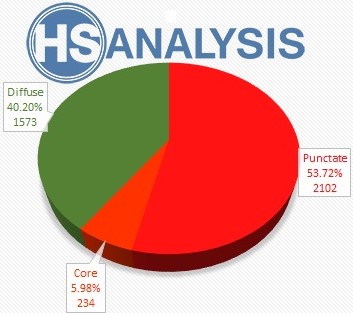
The above pictures of „Neuro COVID 19“ Result table and the chart shows the number and the percentage of each classes. The percentage of the classes shows the Development Phase. In this example the person in Development Phase I.
The evaluation of trained AI models is important and should not solely rely on numerical results. Visual interpretation of results is necessary to ensure the reliability of the model. In this section, visual interpretations of results are presented. Figure (a) shows a specific area without any model or modifications. Figure (b) is the same area with manual annotations, while Figures (c) to (f) show the results of different models. The HyperAmyNet (Type 1) model with 9.6K GTD showed the best characteristics, but still needs more data and modification in settings to improve. In comparing all four models, no punctate class has been detected, which is not related to the number of GTD. An enough amount of data for recognizing an object is 6110 (62.13%) of trained data.
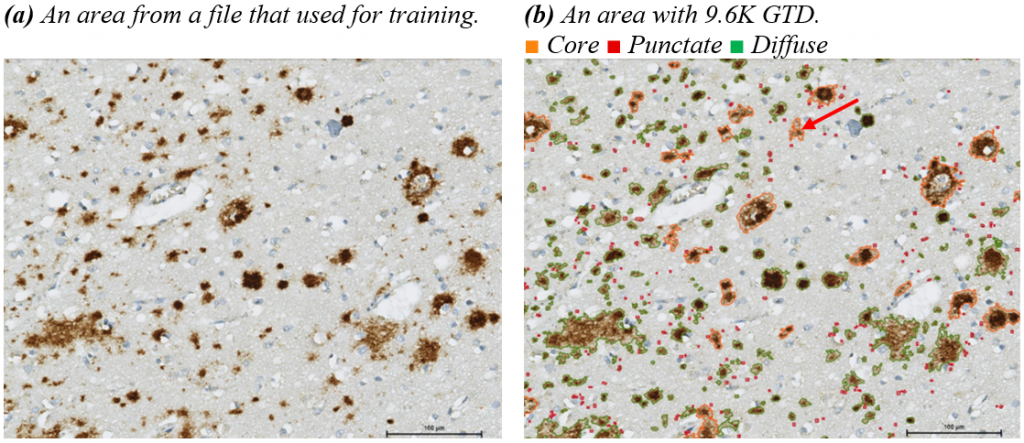
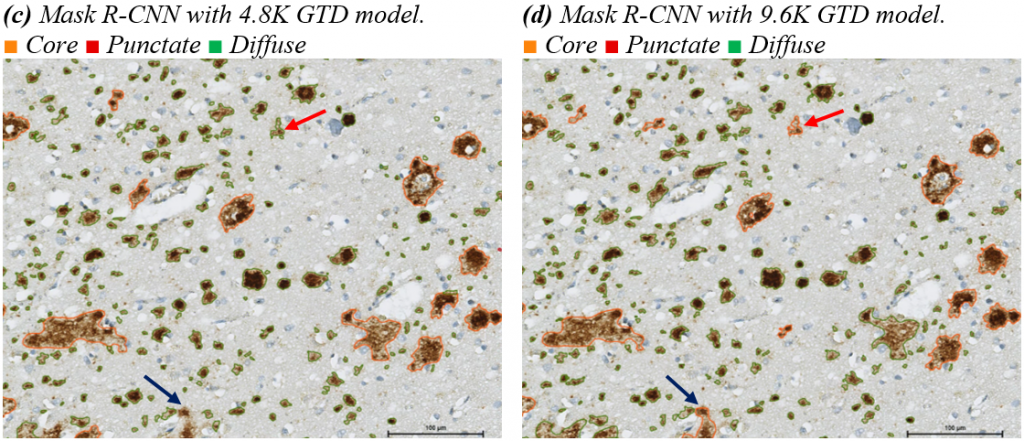
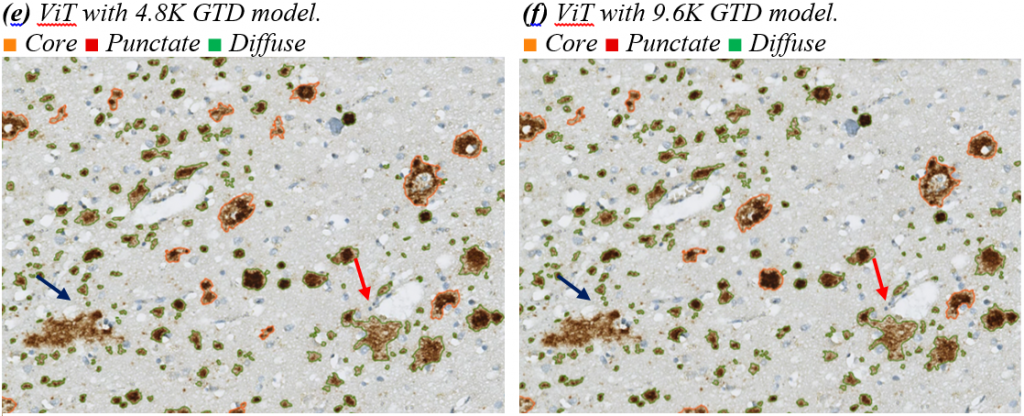
It has been determined that the main issue with recognizing objects in the software is related to the size of the data. The diffuse class has highly variable shapes and sizes, while the core class often has a ring or circle shape that is similar in size to the diffuse class. Additionally, the punctate class is much smaller than the other two classes, which is why it was not recognized in any of the architectures in the HSA KIT software.
xAI Tool
You can use xAI Tool in software HSA KIT to understand the decisions of already trained Deep Learning Models or during the training process. Once you trained a DL model and let it run on the files e.g. here brain sections you can show the results of detection of beta amyloid signals especially the classes like punctate class. By activation xAI and icon heatmap you can easily show the pixels in red which are mostly important for your deep learning model to building the class punctate of beta amyloid. Everything what is blue shows you that DL model use these pixels for building the class punctate as well but does not priories them a lot. In that way you are able to understand the decision of already trained deep learning models as well as during the training process.
The underlying training data and training procedure, as well as the results from AI models, provide the finest understanding of an AI system. This knowledge needs the capacity to map a trained AI model to the actual dataset used to train it, as well as the ability to closely analyze that data. Paying close attention to the data used to train a model is one of the simplest methods to improve its explainability. Teams must establish where the data to train an algorithm will come from, whether the data contains bias, and what can be done to reduce that bias during the design process. xAI Tool in HSA KIT finds the target area containing signal in a certain location and it is a discriminative localization technique that can give visual explanations for any project without needing architectural modifications or training.
By activating the “Heatmap” icon in HSA KIT and selecting a structure, the results appears for that structure in visual way.
The images below shows the heatmap of beta amyloid’s classes. The warm colors (yellow and red) represent areas with higher intensity detected by the model and vice versa.
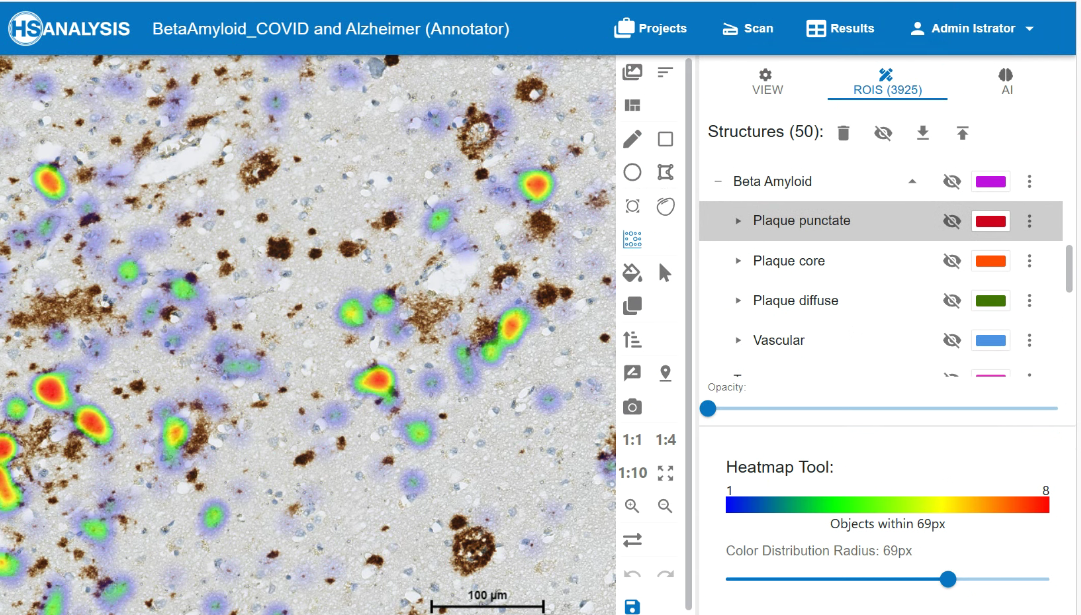
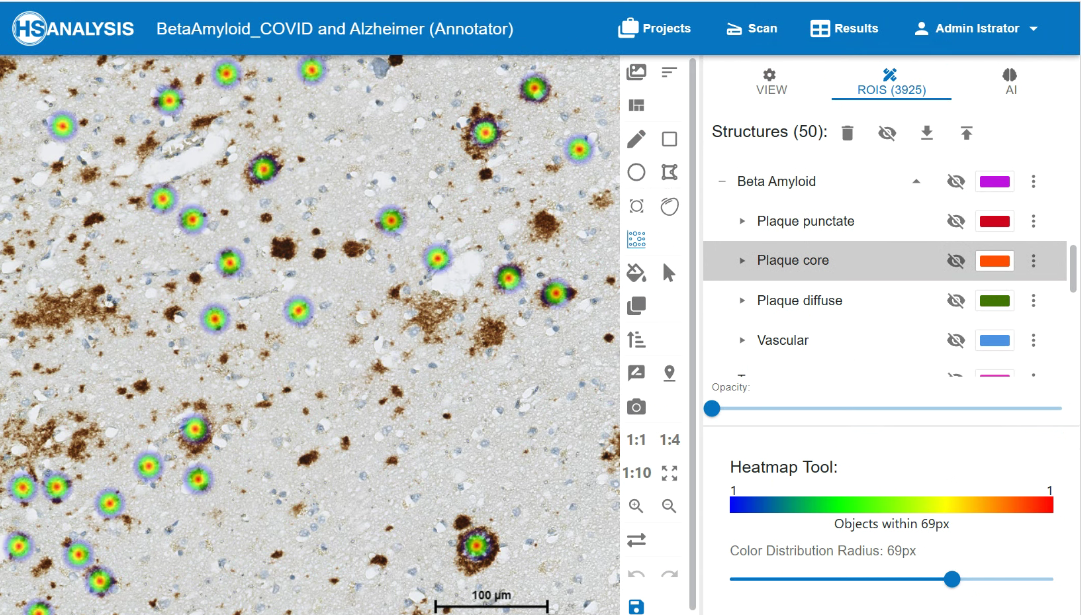
An example of the xAI Tool in HSA KIT to understand why deep learning model classify beta amyloid signals to punctate class. In red we can see the several punctate signals which are near to each other so we can see the distribution within the area 69 pixels. We see in red the pixels and shapes which deep learning prior resizing by building punctate classes as well as blue which are included by building the classes but not so important. So you understand in visual way where your deep learning model performs well on specific class and where not. After that you can check the metrics and decide how you would improve your deep learning model or even simply understand the way of segmentation and classification of your deep learning model for detection of beta amyloid signal and classification punctate, core, diffuse and vascular classes.
Digitalization of histological slides and analysis with HSA KIT
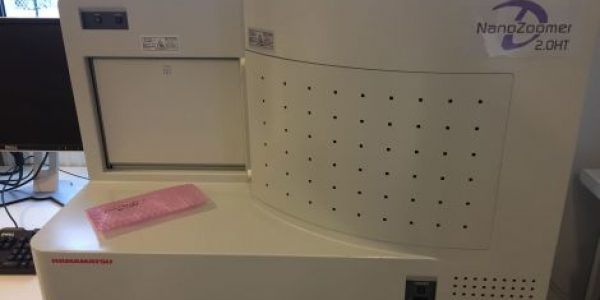
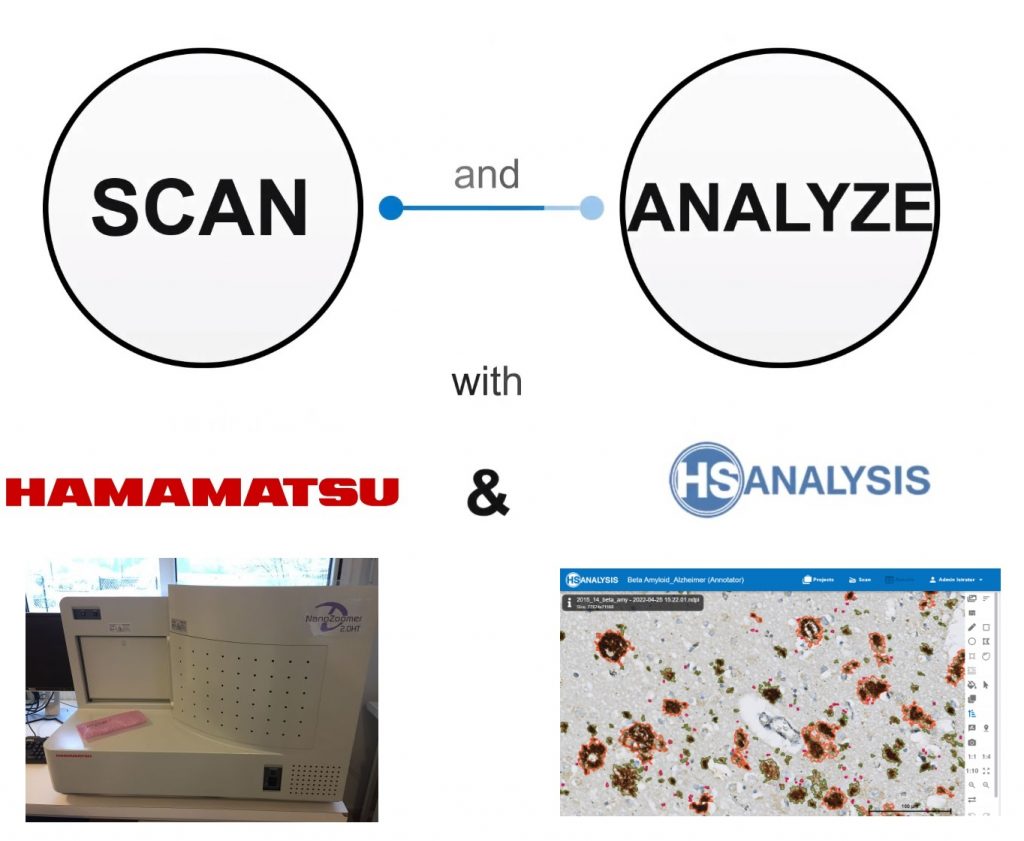
HSA import and work on „NDPI“ files that is the result of Hamamatsu NanoZoomer 2.0 HT device, which is a slide scanner. They are perfectly match to HSA KIT.

If you don’t have a slide scanner and want to get one later, use our inexpensive and affordable software (HSA SCAN M) to manually digitalize the slides directly on your microscope and create manual WSI.
In this video you can see manual scanning that converts slide to a File with HSA SCAN software, So then it can be used by HSA KIT software to be trained, and then automatically be detected by trained AI model.
If you want to scan the slides automatically you can update your microscope to a automated microscope station (HSA SCAN A). That transforms your microscope to an automatic scanner for the low budget and high quality performance in short time.
The only thing HSA need is the dimensions of your microscope and specifications that you want to add and we are going to send a stand and motor for your device that fits your microscope.
This will help you in:
- Scanning faster
- More accurate scanning
- Saving time
- Low budget
In above video, you can see an example of automatic scanner (HSA SCAN A). Do not hesitate to contact us for further information or ordering.
For more information or ordering : sales@hs-analysis.com
Note: This website will be updated in future. The vascular class will be added to the „Neuro COVID 19“ Module. And the Tau and its classes data will be added to this website as well.